


- The Polkadot price is testing the resolve of a significant trend line on Tuesday, which will dictate if the bull market is still intact.
The Polkadot price is testing the resolve of a significant trend line on Tuesday, which will dictate if the bull market is still intact.
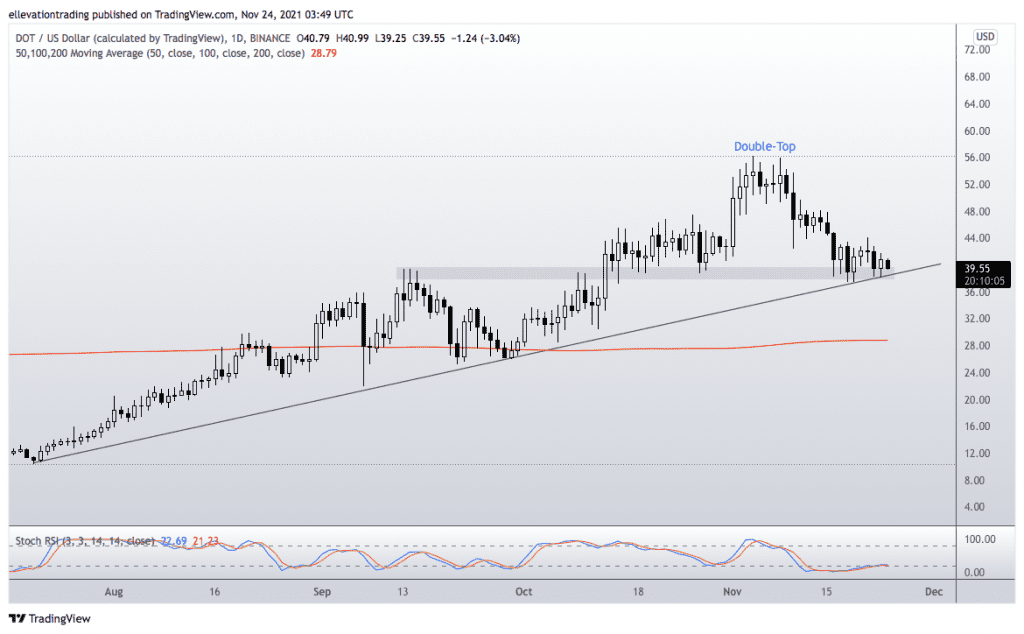
The DOT token has erased yesterday’s gains and down 3% a $39.55 in early Asian trading. Although Polkadot is unchanged over the last seven days, it has fallen 30% from the $56.22 all-time high set earlier this month. Despite the recent reversal, Polkadot’s market cap is a healthy $39 billion, ranking it the 8th-largest cryptocurrency behind Ripple (XRP).
Like Bitcoin (BTC) and Ethereum (ETH), DOT reached a record price at the start of November before reversing course. Over the last three weeks, the Polkadot price has been trending lower, dragging it back to the support of a four-month uptrend. Encouragingly, the price is bouncing from trend support, although not by much. As a result, selling could soon overwhelm the buying ahead of trend support, triggering a sharp decline. On the other hand, if DOT holds above the trend, it will reinforce the validity of the support and keep the overall bull market intact.
DOT Price Analysis
The daily chart shows a rising trend line from July at $38.50 and a series of highs around $39.00 combine to provide significant confluent support. As long as DOT remains above this level, it should trade with a bullish bias, targeting the November ATH. However, a break below support could instigate an acceleration towards the 200-Day Moving Average at $28.79.
For now, the bulls are still in control of the price, and therefore, the bullish argument holds value. However, a daily close below $38.50 favours the bears and invalidates the optimistic view.

Polkadot Price Chart (daily)
For more market insights, follow Elliott on Twitter.