

- Palladium price has been in a consolidation phase in the past few days as investors focused on the ongoing supply and demand dynamics.
Palladium price has been in a consolidation phase in the past few days as investors focused on the ongoing supply and demand dynamics. The metal was trading at $2,160, which was about 37% below the highest level this year. It has about 21% above the lowest level this year. Other metals like platinum and gold have also struggled.
Strong US dollar
Palladium and other metals have been in a tight range in the past few months as investors focus on the strong US dollar. The dollar index (DXY), which tracks the greenback against other top currencies, has soared to the highest level in more than two decades.
This rally happened as investors focused on the extremely hawkish Federal Reserve as US inflation soars. Historically, precious metals like gold and palladium tends to move in the opposite direction of the US dollar.
Palladium price has also struggled because of the shifting dynamics on demand and supply. Data published by Heraeus showed that supply will increase by 1.6% this year compared to the 25.3% it had in 2021. For example, South Africa’s supply is expected to increase from 4,540 koz to 4,560 koz. In Zimbabwe, it is expected to rise from 480 koz to 495 koz.
At the same gross demand is expected to have rallied from 6,720 koz to 7,140 koz. As a result, the market balance will be 1,035 koz. This supply deficit explains why the palladium price has done well in the past few years.

Palladium price has therefore wavered because of the substantially strong US dollar and the falling industrial production in key countries like China. The metal is used mostly in the auto industry, where it is used as a catalytic converter.
Palladium price prediction
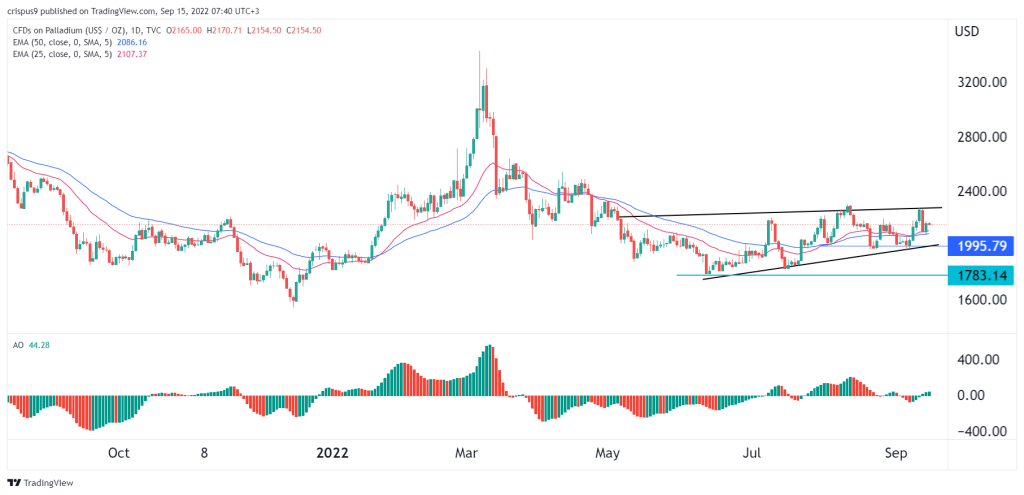
The daily chart shows that palladium price has been in a tight range in the past few days. Along the way, the metal has consolidated at the 25-day and 50-day moving averages. It is also between the channel shown in black while the Awesome Oscillator has moved slightly above the neutral level. This channel has a resemblance to a rising wedge.
A closer look reveals that the metal has formed a head and shoulders pattern. Therefore, there is a likelihood that palladium price will have a bearish breakout. If this happens, the next key level to watch will be at $1,780. A move above the resistance at $2,200 will invalidate the bullish view.