

- NZDUSD is one of the biggest losers today as concerns about rising coronavirus cases in Beijing spark risk aversion. Can NZ GDP provide it with support?
NZDUSD is one of the biggest losers in today’s Asian session as concerns about rising coronavirus cases in Beijing spark risk aversion. As of this writing, the currency pair is down by 0.19% as it trades at 0.6438. Will the currency pair find support from New Zealand’s GDP report?
According to reports, there has been a resurgence in coronavirus cases in Beijing as of late. The local government has announced a lock down of residential areas with people not being allowed to leave the city. This has dampened market sentiment because investors are worried the other countries would soon follow suit in re-imposing lockdowns.
On top of that, reports that North Korea blew up the inter-Korean liaison office in Kaesong has also put investors at the edge of their seats. The office was setup to improve diplomatic relations between the two countries and if these reports turn out to be true, geopolitical tensions could further spark risk aversion.
Later tonight, at 11:45 pm GMT, the Q1 2020 GDP report from New Zealand will be on tap. A better-than-expected figure could help NZDUSD attract more bids in the market with the consensus at -1.0%. Alternatively, a disappointing reading could further weaken the Kiwi.
Download our Q2 Market Global Market Outlook

NZDUSD Outlook
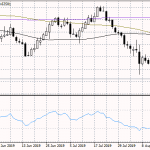
On the weekly time frame, it can be seen that NZDUSD is testing a confluence of resistance. For one, the currency pair is trading at the falling trend line when you connect the highs of February 11, 2018 and December 22, 2019. The 100 SMA also aligns nicely with the current price where NZDUSD is trading, around 0.6430. Additionally, it’s worth pointing out that last week’s candlestick closed as a shooting star. When you enroll in our free forex trading course, you will learn that this is widely considered as a bearish reversal signal.
However, it’s worth pointing out that a closer look at the 4-hour time frame would show that the currency pair is currently testing support. By connecting the lows of May 26, May 29, and June 15, it can be seen that NZDUSD is currently trading just above a rising trendline. Reversal candlesticks around its current price at 0.6430 could indicate that there are still buyers in the market. Should this happen, the currency pair could soon trade all the way up to its near-term resistance at 0.6590 where it topped on June 9.