
- NIFTY 50 Forecast: after a couple of months of FPI selling, Indian shares are once again gaining momentum amid falling bond yields.
The Indian equities have been showing a very strong recovery last week. The trend continues this week as the Nifty 50 and BSE Sensex both indices opened higher on Monday. This recovery rally comes after a sharp sell-off in Indian shares in the last two months.
The NIFTY 50 index opened 115 points higher on Monday. At the time of writing, the index stood at 19377 points. A similar trend was observed in the BSE Sensex which also opened higher and gained 416 points during the first trading session of the week.
The ongoing recovery rally in the Indian stocks can be attributed to the shift in market sentiment on Wall Street. This trend change is due to the correction in the DXY index and a pullback in the bond yield. The yield of the 10-year T bill has dipped to 4.59% from its 15-year peak of 5.02% which was achieved in October 2023.
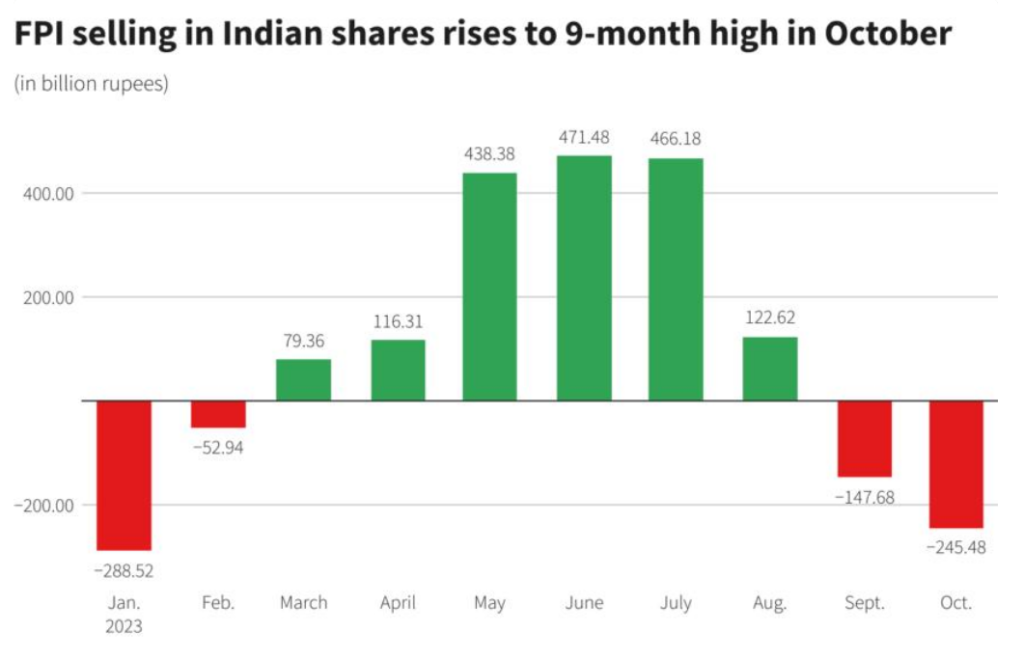
Axis Bank, Hero MotoCorp and Adani Ports led the gains on the first trading day of the week. This positive sentiment in the market comes after an aggressive sell-off in the markets by Foreign Portfolio Investors (FPI).
In October 2023, the FPI selling in the Indian shares hit its 9-month high as foreign investors dumped $2.43 billion worth of Indian equities. This resulted in a 2.84% drop in the Nifty 50 index and a 2.97% correction in the BSE Sensex index.

Nifty 50 Technical Analysis
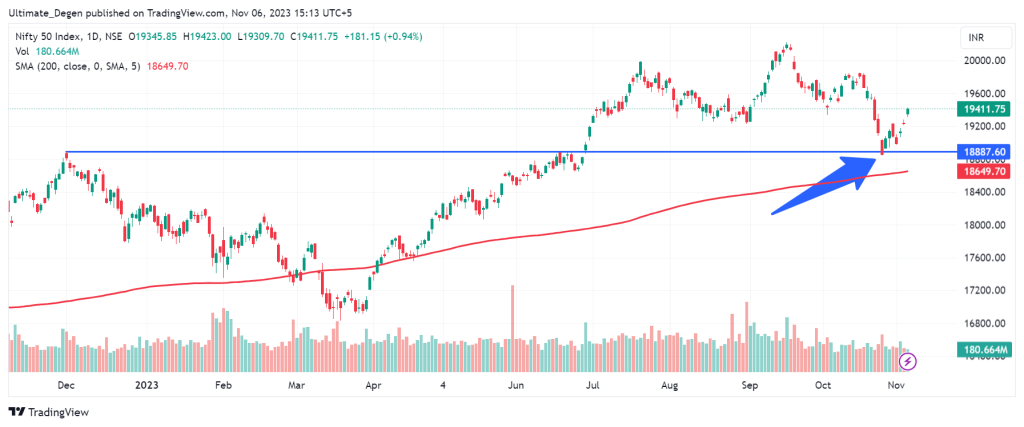
The following chart is for those who say that the technical analysis doesn’t work. The benchmark index which tracks the top 50 Indian companies had a perfect bounce from the December 2022 high of 18,887 at the end of last month. Since then, the NIFTY index has gained almost 3%.
However, it is still too soon to say if the ongoing rally will result in fresh yearly highs as the Nifty 50 index is still down 3.93% from its current yearly peak. If the index gains strength above 19,330 points, I expect a retest of 19,850 in the coming weeks. The invalidation of this bullish forecast will be a breakdown below the 19,230 support level.
Article Sources
- Reuters article, https://www.reuters.com/world/india/fpi-selloff-indian-shares-hits-nine-month-high-october-nsdl-data-2023-11-06/
- FPI selling chart from National Securities Depository Ltd.
- NIFTY 50 index chart by Tradingview.com..