
- NASDAQ 100 Index Forecast: The latest analysis reveals that INDEXNASDAQ: NDX is retesting the August 2022 high and may have a short pullback.
NASDAQ 100 index (INDEXNASDAQ: NDX) has been outperforming major global indices since the start of 2023. The benchmark index has soared 23.8% during this time. The latest analysis reveals that while the bulls are gaining momentum, at least a short pullback is still on the cards.
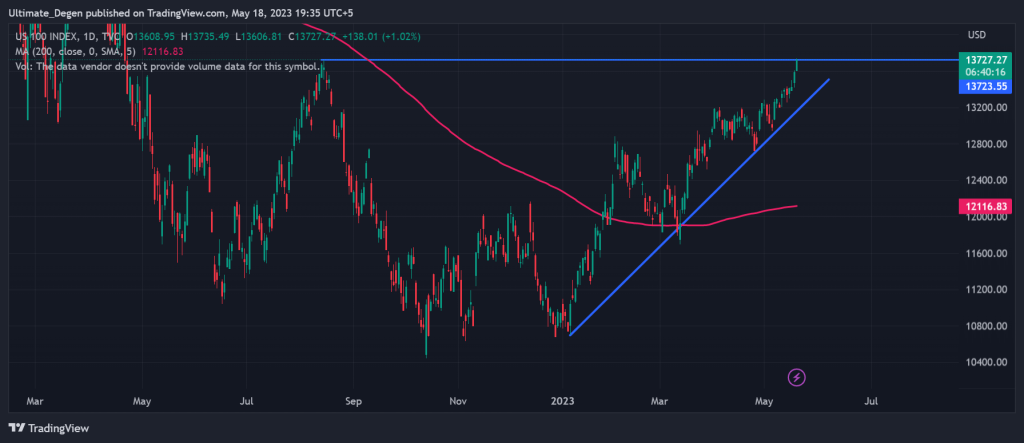
On Thursday, the NASDAQ 100 index turned green once again. At press time, the index was trading at 13,700 points which translated into a daily gain of 0.82%. This is also the highest level for the index since 16 August 2022.
Why Is NASDAQ Rallying?
There are multiple factors behind the ongoing rally in NDX. While the S&P 500 index SPX is still struggling to break above its yearly highs, Nasdaq 100 index has already surged to its highest level in 9 months. This shows that investor interest in tech stocks has significantly increased this year.
The biggest tailwinds for the index tracking most of the tech giants were the Q1 earnings of its biggest constituents. Apple, Microsoft, Alphabet, Meta, and Nvidia all released strong earnings reports for the first quarter of 2023. This calmed down the recession fears among tech investors. The April 2023 CPI data also played a role in fueling the uptrend.
NASDAQ 100 Index Retests Major Resistance
Technical analysis of INDEXNASDAQ: NDX reveals that the index has been respecting the upward trendline since the start of 2023. The benchmark index has bounced off this trendline multiple times during this period. A closer look at the chart reveals that the price is currently retesting one of the major resistances on its chart.

This is the 13,700 resistance which also marks the August 2022 high. NASDAQ 100 index forecast will flip extremely bullish if it breaks above this level and holds. However, the most likely seems to be a pullback from this resistance. This may result in another retest of the upward trendline shown on the following chart.
I’ll keep posting my NASDAQ forecast in my free Telegram group, which you’re welcome to join.