

- In this article, we look at why US futures have dropped today while the fear and greed index is at 60. The Nasdaq 100, Dow Jones, and S&P 500 are in the red
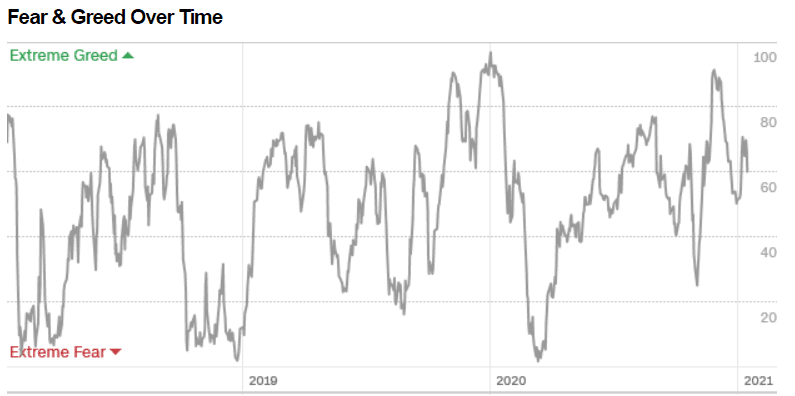
US futures are in the red today as the country is celebrating the Martin Luther King day. Still, investors are focused on this week’s earnings barrage from the US. The Dow Jones, S&P 500, and Nasdaq 100 futures are all down by more than 0.25%. The fear and greed index has moved from last week’s 71 to 60.
What’s happening: The US equity market will be closed today. At the same time, investors are looking ahead to important corporate earnings from companies like Bank of America, Netflix, Charles Schwab, Goldman Sachs, State Street, Procter & Gamble, United Health, Morgan Stanley, and Bank of New York Mellon, among others. Investors are also focusing on the upcoming inauguration of Joe Biden.
Fear and greed: On Friday, the fear and greed index was at 60, indicating some greed in the market. The stock price strength was in extreme greed while the market momentum, breadth, and put and call options are in the greed zone. The junk bond demand and safe-haven demand are in the extreme fear and fear respectively.
Elsewhere: In Europe, futures tied to the FTSE 100 and DAX index are also in the red ahead of the ECB decision on Thursday and a speech by Andrew Bailey set for later today. They are also looking ahead to earnings from companies like Rio Tinto, Experian, and Premier Foods that will come out tomorrow.
In Asia, the Hang Seng index up by more than 220 points while the Shanghai Composite is up by more than 30 points. In Japan, the Nikkei 225 is down by more than 276 while in Australia, the ASX 200 index is down by 52 points.

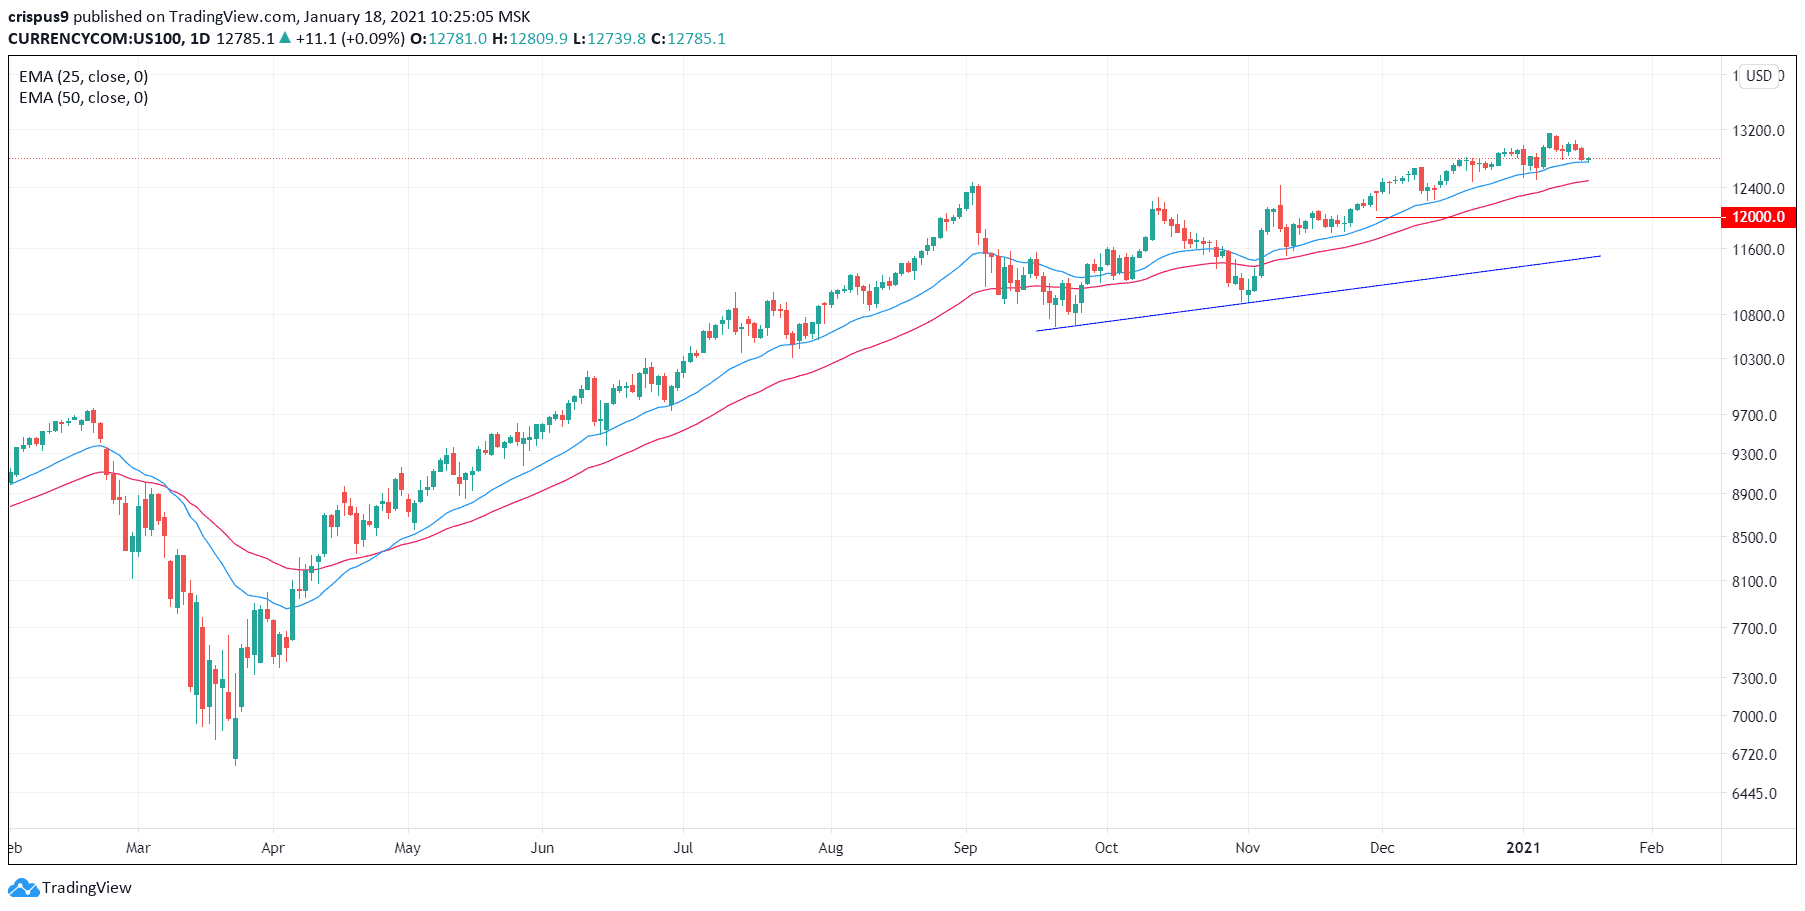
Nasdaq 100 technical outlook
The Nasdaq 100 index has been under pressure recently as traders look ahead to more regulations in the incoming Joe Biden presidency. On the daily chart, the index has moved from the all-time high of $13,133 to the current $12,783.
The price is slightly above the 50-day and 25-day exponential moving averages. Therefore, this week, the index will likely continue rising because of the possible strong earnings data.
Nasdaq 100 technical chart