Bullish Mullen Automotive stock price predictions have hit the market following the announcement of positive results of a recent battery test by Mullen Automotive Inc. The company saw its shares surge in after-market trading hours after it reported better-than-expected results from the testing of its solid-state polymer cell batteries.
According to the details of the tests, the solid-state battery cell produced 343.28 ampere-hours at 4.2 volts, which exceeded the test tolerance expectations of a previous EV Grid Test. This previous test had seen the solid-state battery rated at 300 ampere-hours at 3.7 volts.
Mullen says that a full-charged 150-kWh solid-state battery could power the Mullen Five EV Crossover for more than 600 miles. The company forecasts an impressive future for solid-state batteries. The results produced a demand for the company’s stock, allowing it to surge more than 56% in Tuesday’s trading.
The results could provide a basis for future bullish Mullen Automotive stock price predictions. Solid-state batteries are expected to be the future of batteries for EVs as they result in less degradation when charged repeatedly. They also have a better safety profile than existing batteries.
Mullen Automotive Stock Price Prediction
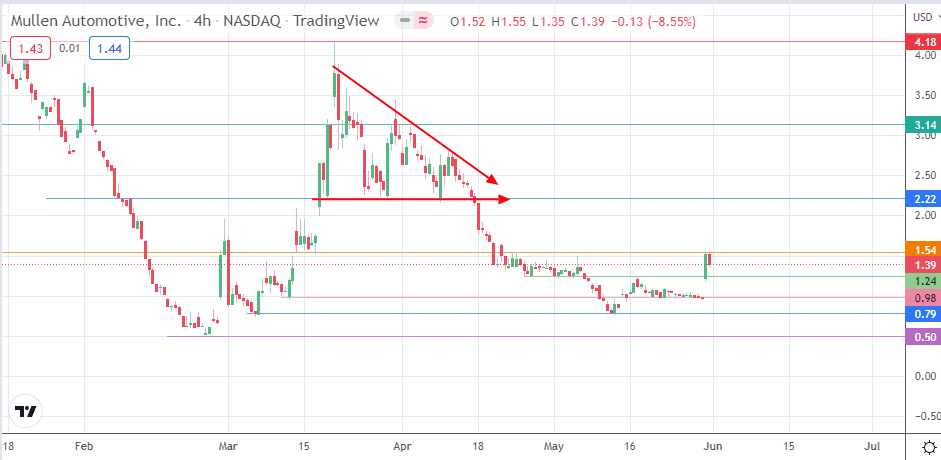
Technically speaking, the recent decline from mid-March occurred due to the resolution of the descending triangle. The price drop extended below the completion point, eventually finding support just above the previous all-time low.
The 4-hour chart shows that the recent uptick in price resulted from completing a relatively flat bullish pennant. This gap-and-go breakout has met resistance at the 1.54 price mark (16 March low and 25 April high).
The bulls must uncap this resistance to make way for an advance that targets the 2.22 barrier (triangles lower edge and previous lows of 30 March and 8 April). 2.78 forms a minor barrier (28 January low and 11 April highs), before 3.14 enters the picture as a potential target to the north.
On the flip side, a continuation of the rejection move from 1.54 to the downside retests the 1.24 support level (2 May low and 17 May high). If the bulls fail to defend this support, a further decline toward 0.98 may follow. 0.79 forms another southbound target (7 March low and 12 May high) before the all-time low at 0.52 comes into the mix.
MULN: Daily Chart