



Archived Article This article was published more than 5 months ago. The market data, prices, forecasts, and analysis were accurate at the time of publication but may have changed since then. Please use this article for historical reference only and refer to our latest content for current market information.
- The descending pattern on the daily chart is an indication for the Loopring price predictions to become negative.
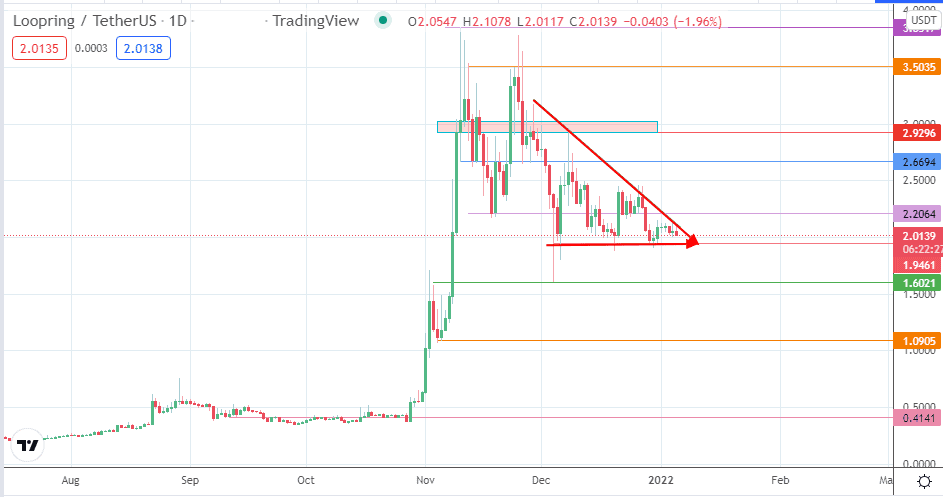
The likelihood of the LRC/USDT pair facing a further selloff is being heightened by the near completion of the descending triangle on the daily chart. This bearish pattern will undoubtedly bring about pessimistic Loopring price predictions if it plays out.
Once the darling of investors chasing the bullish run of November 2021, Loopring now finds itself in dire straits as buying momentum on the LRC/USDT pair dries up. The decision by the r/CryptoCurrency Reddit group to censor posts related to Loopring in favour of those promoting Polygon did not help the cause of the token.

Loopring declined more than 24% in December. It has started the year on a negative note with a 4.3% loss for the week as of writing.
Loopring Price Prediction
The descending triangle points to further price deterioration below the 2.0111 support level, completing the measured move at 1.0905. This move is expected to take out the 1.6021 support mark along the way.
However, the bulls require a strong bounce that takes out 2.2064 to save the day. If this occurs, the price barrier at 2.6694 would become the next logical target to the upside. 2.9296 and 3.5035 are additional targets to the north which only become visible if the bulls can push the advance with solid momentum.
LRC/USDT: Daily Chart
Follow Eno on Twitter.