
You would have been correct if you had a Loopring price prediction of a potential correction on the LRC/USDT pair. The daily chart indicates a minor trend to the upside, but this trend has been punctuated severally by price corrections as the market continues its seesaw movements.
The LRC/USDT pair has shown a surprisingly strong correlation to Bitcoin prices in the last three months. The latest decline in the price of Loopring follows a similar correction on the BTC/USDT pair, following Bitcoin’s surprise jump above 47,000 last week. At the same time, the LRC/USDT pair spiked to 1.3620, the highest since the start of the year. If you love to trade perpetual CFD contracts on cryptocurrencies, this is one pair to watch for as it has excellent volatility and a positive correlation with Bitcoin.
It is important to note that the correction from November 2021 was a retracement of more than 80% from the asset’s highs. The tide appears to have turned after the bounce on the 0.6342 price mark. However, the accompanying recovery move is expected to face several hurdles before the LRC/USDT pair can get close to its previous highs. The 2022 high at 1.3620 appears to be the immediate hurdle in the medium term that needs to give way for any bullish Loopring price predictions to take hold.
Loopring Price Prediction
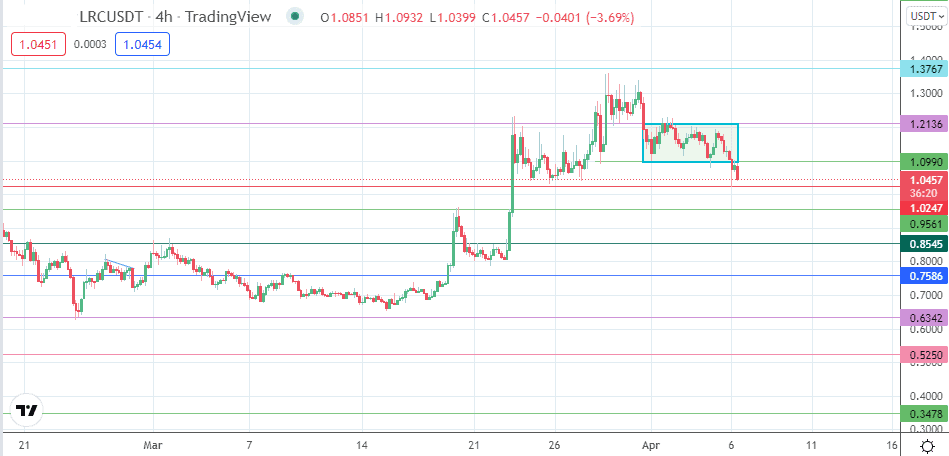
The breakdown of the rectangle pattern and subsequent decline completes the pattern’s expected role as a continuation pattern. The measured move is expected to end at the 1.0247 support level (8 February and 25 March low). However, this level is facing severe pressure from the bears. A breakdown of this price level targets the 0.9561 support level. If the decline continues, subsequent pivots at 0.8545 and 0.7586 will be engaged and will become additional targets to the south.
On the flip side, a bounce at 1.0247 will result if the bulls can successfully defend this price mark. The accompanying bounce will target 1.0990 initially, before 1.2136 (former ceiling of the rectangle pattern). 1.300 and 1.3767 are additional targets to the north, but these will become viable if the bulls take out the 1.2136 price resistance.
LRC/USDT: Daily Chart
Follow Eno on Twitter.