- What is the outlook of the Jasmy price? We explain what to expect now that the Jasmy coin price has staged a recovery.
Jasmy price has made a spectacular comeback in 2023 as demand for the coin jumped. It rose to a high of $0.006 on Thursday morning following the relatively dovish statement by the Federal Reserve. It has jumped by over 107% from the lowest point in 2022, meaning that its investors have more than doubled their money. Still, it remains sharply below the highest point on record.
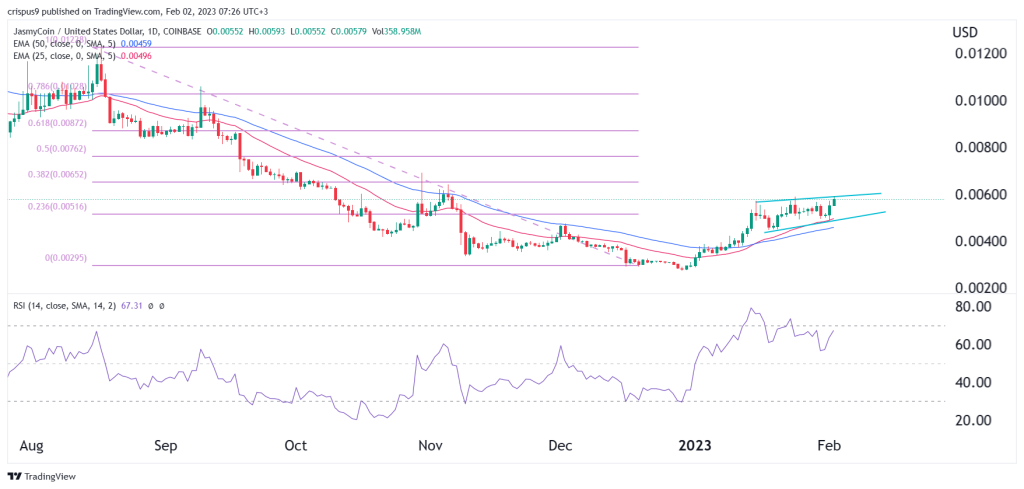
JasmyCoin price forecast (1D chart)
On the 1-day chart, we see that Jasmy has been in a strong bullish trend in the past few days. In this period, it has managed to move above the 23.6% Fibonacci Retracement level. It is also being supported by the 25-day and 50-day EMAs. From a distance, Jasmy seems to have formed an inverted head and shoulders pattern, which is one of the most accurate reversal patterns.
Jasmy also seems to be forming a rising wedge pattern, which is usually a bearish sign. But this pattern has a few days to go before it reaches its confluence point. The Relative Strength Index (RSI), which looks at the speed of change, seems to be forming a bearish divergence pattern.

Therefore, I suspect that JasmyCoin price will continue darting higher in the coming days as buyers target the 50% Fibonacci Retracement level at $0.0076, which is about 32% above the current level. On the flip side, a drop below the rising wedge pattern at $0.0048 will invalidate the bullish view.
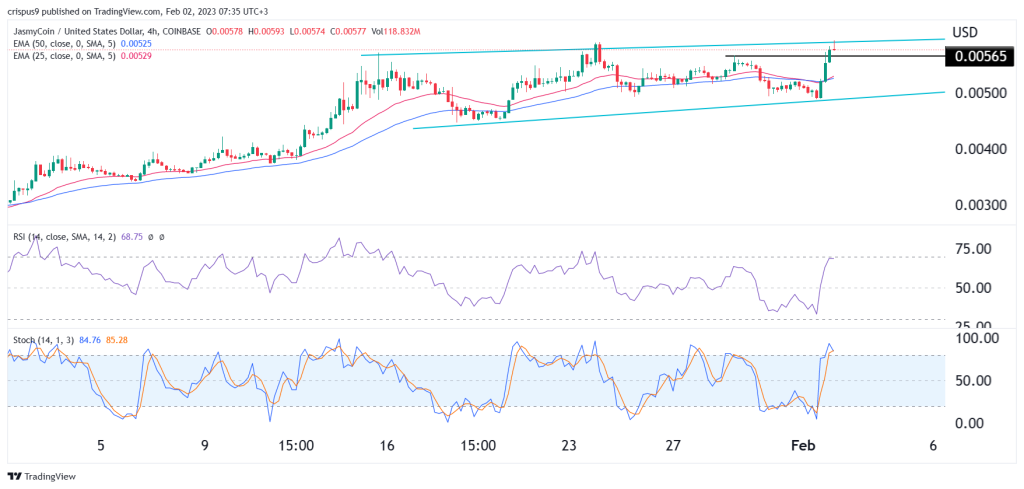
Jasmy price forecast (4H)
The ascending channel I mentioned on the daily chart is now clearer on the 4H chart. On the chart, we see that the coin managed to retest the upper side of the channel and is now in the process of forming a shooting star pattern. In technical analysis, this pattern is one of the best accurate predictors of a reversal. The Relative Strength Index has moved slightly below the overbought level.
The price is also slightly above the short and longer-term moving averages and is also slightly above the key resistance at $0.0056, the highest point on January 29. At the same time, the Stochastic Oscillator has moved to the overbought level.
Therefore, while the short-term outlook for the Jasmy coin price is bullish, we can’t rule out a situation where it pulls back as sellers target the lower side of the channel at $0.0050. This retreat will be a healthy one since the price is still inside the ascending channel.