
- A blowout U.S. payrolls report has fueled global "higher-for-longer" interest rate fears, sparking a massive 4% tech-led selloff in the Nikkei 225 as investors aggressively pull capital out of high-flying semiconductor stocks.
The Nikkei 225 is trading with heightened volatility, driven by several factors. After rallying to an all-time high of 68,402.13, the benchmark index plunged nearly 4% on June 8 and is now testing the 63,400–64,000 psychological range. The decline followed the release of the stronger-than-expected U.S. May employment report, which revived concerns about further U.S. interest rate hikes. As a result, risk-off sentiment intensified rapidly, putting pressure on the Tokyo stock market. The pullback can largely be attributed to profit-taking activity, particularly among AI and semiconductor-related stocks.
Moreover, rising speculation about an additional Bank of Japan rate hike in June has reinforced investors’ risk-averse stance. Japan’s revised Q1 2026 GDP expanded by 0.5% quarter-on-quarter, providing further evidence of economic resilience and giving the Bank of Japan the green light to continue normalizing monetary policy. Markets are now aggressively pricing in a 65% probability that the BOJ will raise its benchmark interest rate from 0.75% to 1.0% at its upcoming late-June meeting, applying additional pressure on the discount rate and highly valued technology stocks.
Nikkei 225 Technical Outlook:
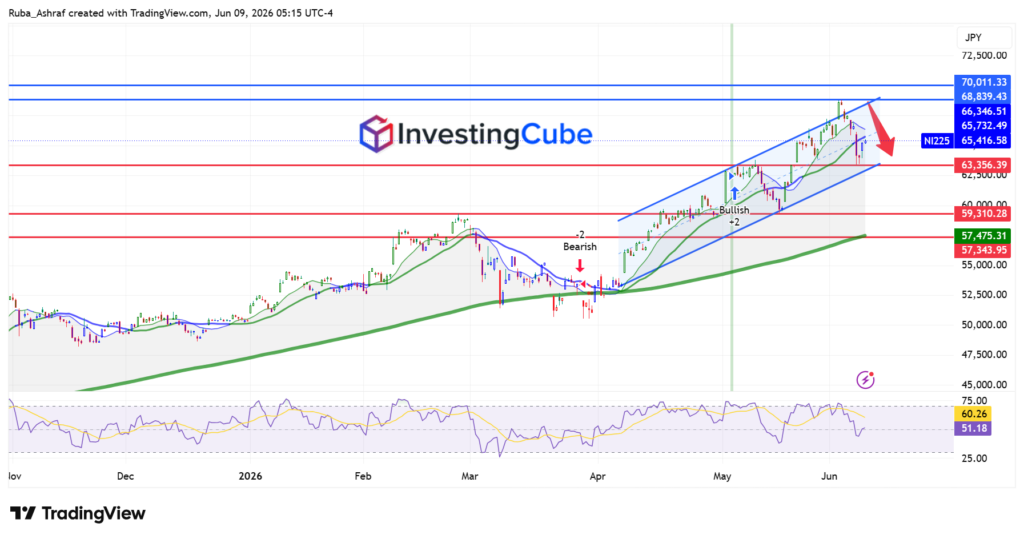
The 4-hour chart shows a strong bullish trend that has recently entered a corrective phase after reaching a new all-time high. The broader trend remains bullish. Since early April, the index has been trading within a well-defined ascending channel. It was consistently posting higher highs and higher lows. Throughout May and early June, the rally accelerated, pushing the Nikkei to a record high near 68,839 before sellers emerged aggressively.
The recent sell-off began when buyers lost momentum near the upper boundary of the channel. This movement indicates that the market is undergoing a healthy correction rather than a confirmed trend reversal at this stage.
Key Resistance Levels:
The most important support is currently sitting around 63,356-64,025, aligning with the upper boundary of the channel and the previous breakout zone. The price is testing this region, which will determine the next directional move.
A decisive breakout below the lower boundary of the channel would weaken the bullish structure. And gradually pave the way toward the next support level at 59,310. Further downside could then target 57,344, which aligns closely with the longer-term moving average and a previous consolidation area.

What do the moving average and RSI tell you?
The shorter-term moving averages remain above the longer moving average, confirming that the primary trend is still upward. However, the sharp decline has pushed the price below the fast-moving average, indicating a loss of short-term momentum.
The medium moving average is currently acting as dynamic support. A decisive close below such dynamic support could accelerate selling pressure toward the lower support levels.
The RSI has dropped below the 50 level, suggesting that sellers have gained near-term control. However, the RSI is not yet in oversold territory. This means that there is still room for additional downside before any catalyst or technical conditions become stretched.
Potential Scenarios:
If the price holds on the 63,356-64,025 support zone, buyers could attempt to stabilize and initiate another upward move within the channel. A rebound above the 65,458 would be a sign that bullish momentum is returning. A break above 66,599 would likely pave the way for a retest of the high at 68,839.
On the downside, a decisive break below the ascending channel and a close below 63,356 would deepen the correction. In that case, downside risks would increase toward 59,310, followed by 57,344. This move would signal that the recent rally is transitioning from a normal pullback into a more aggressive trend correction.