

- The Crude Oil price suffered its biggest one-day drop since trading negative in 2020, but don't get too bearish just yet.
The Crude Oil price suffered its biggest one-day drop since trading negative in 2020, but don’t get too bearish just yet.
Global energy prices slumped in Friday’s post-holiday trading session as fears over the new Ominicron Covid strain rattled risk markets. In scenes reminiscent of March last year, equity Inidices, commodities and cryptocurrencies crumbled under the weight of relentleess selling. The WTI Crude Oil price finished a staggering $10 (-13%) lower on the day, slicing through significant support levels in the process. But whilst the drop may be welcomed by strained consumers, in my opinion it may not last for long.
Whilst the sell-off was undoubtedly triggered by the virus, several factors combined to exaggerate the price action. The light trading volume, clearly has a part to play, as do momentum chasing algorithms. But the biggest factor was the leveraged longs gambling on higher Crude prices. Speculative length in the Crude markets was running close to record highs, and many of those longs positions will almost certainly have been wiped out on Friday, which is healthy for the price in my opinion. Furthermore, according to Goldman Sachs, the current Crude Oil price equates to a drop in demand of 4 million barrels per day for the next three months. Considering demand dropped by around 2 mbpd during last years pandemic, Friday’s move appears extreme.
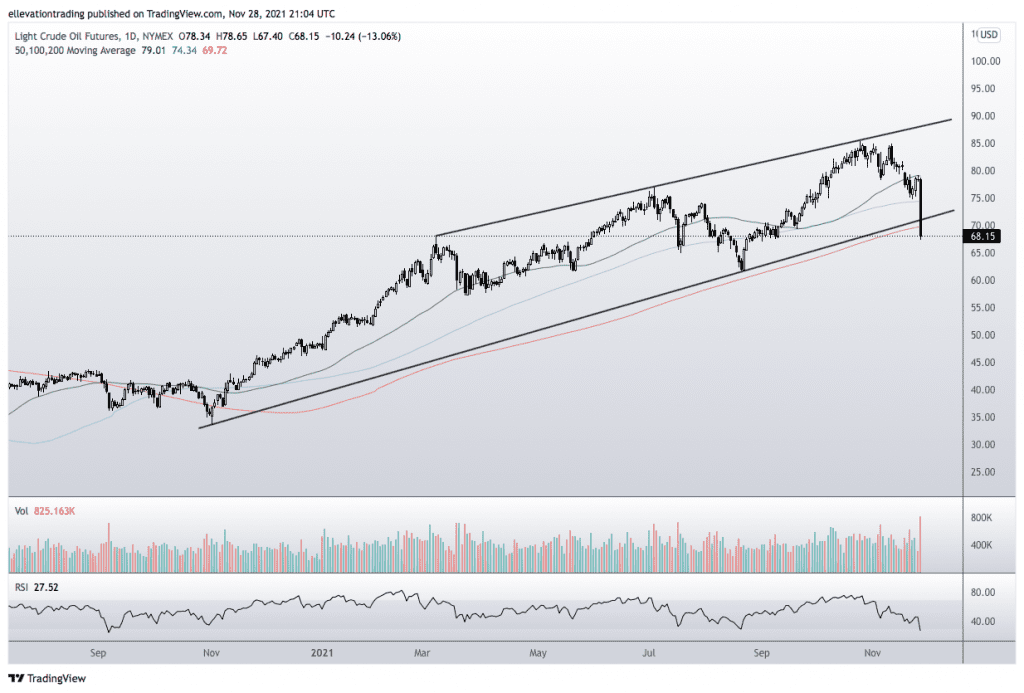
WTI Price Analyis
The daily chart shows WTI Crude finished Friday beneath the 200-Day Moving Average and trend support. Whilst, the breakdown is negative and likely to attract selling, the Relative Strength Index shows the sell-off is overdone. Furthermore, the market is pricing in a ‘worst-case scenario’ at the moment, which may not prove true.
Because the price broke has down through technical support, it may attract selling in the near-term. However, despite the technical backdrop, the fundamentals still hold up for now. On that basis, selling into the weakness may be hazardous. Furthermore, the reduction in length leaves the price vulnerable to an upside shock.

A logical trigger for a melt-up, would be if WTI reclaims the 200-DMA at $69.72 and the trend line at $70.90. If that happens, the systematic sellers may reverse course and longs may repoen positions. Therefore, my preference would be to buy WTTI on a close above $70.90, placing a stop below the 200-DMA at $69.72.
Crude Oil Price Chart (Daily)
For more market insights, follow Elliott on Twitter.