

- Joshua Rotbart, the respected analyst expects the gold price will reach $2,300 in the coming year because of low interest rates and weak demand
Gold price (XAUUSD) is still in consolidation after falling sharply on August 11. The metal is trading at $1928, which is about 0.30% lower than yesterday’s closing price. Similarly, silver and copper prices are all in the red today.
Why Gold is Dropping
There are three primary reasons why gold price has been falling recently. First, psychology has played a key role in the current trend. That is because the consolidation started when the price reached an all-time high of $2,070 in August. Whenever an asset clinches its all-time high after an impeccable rally, some bulls tend to take profit. There is usually an indecision about whether the price will continue rising.
Second, the price of gold has dropped because of the stronger US dollar. After months of declines, the US dollar turned around this month and started an upward rally. This happened as traders started to buy the dollar, which they believe was oversold before then. The dollar index has climbed to the current level of $93.55, which is higher than this month’s low of $91.5.
Third, the XAUUSD pair has been in consolidation because of the current market environment. In the past week, most global assets have been in a downward trend. Global stocks like the Nasdaq and Dow Jones have been in a steep downward trend. This trend is mostly because of the previous overvaluation and profit taking.
Rotbart believes gold price will rise to $2,300
Still, some analysts believe that the price of gold will continue to rise. In an interview yesterday, Joshua Rotbert, a leading gold analyst and founder of J.Rotbert Metals, believes that the price will end the year at $2,300. He argued that the current low-interest rates environment will lead to higher inflation. And gold and silver are good hedges against inflation because their prices rise whenever other assets rise as well.

Gold technical outlook
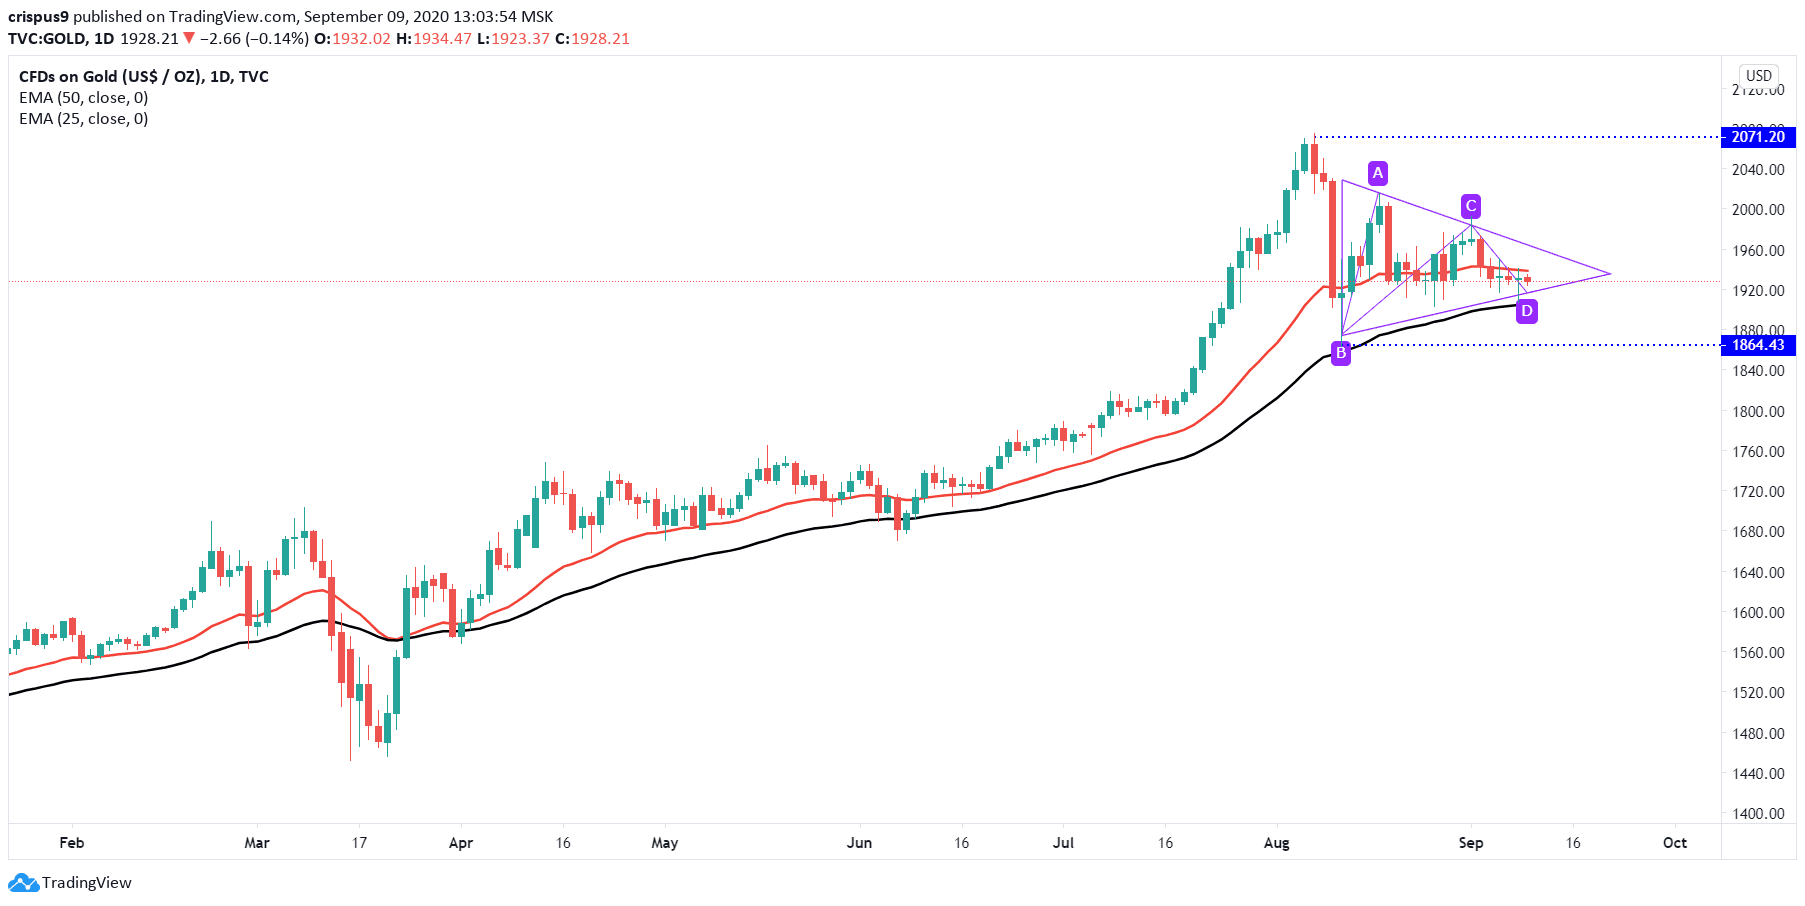
The daily chart below shows that gold price has moved sideways in the past four days. And, the metal has formed a triangle pattern that is shown in purple. The price is also along the 25-day exponential moving averages and slightly above the 50-day EMA.
Therefore, with the price nearing the “tipping” point of the triangle pattern, there is a possibility that it will soon break out. And I suspect it will breakout higher considering that this triangle resembles an extended pennant pattern. If it does break out, the price will likely test the YTD high of $2,070. On the flip side, a move below $1,865 will invalidate this trend.
Do you want to be an excellent trader? Register for our free forex trading course and get trained by traders with decades of experience in the industry.
Gold Price Technical Chart