

- Gold price sinks after a second month of better-than-expected Non-farm Payrolls (NFP) data props up the greenback against the yellow metal.
Gold price on the XAUUSD chart sank to intraday lows of $1760 after today’s upbeat Non-Farm Payrolls (NFP) data. The NFP employment data released by the US Bureau of Labour Statistics indicates that the US economy added 4800K jobs in June 2020, which was an increase over the 2699K job additions seen in May 2020 (an upward revision) and also higher than the 3037K additions predicted by analysts. The unemployment rate also fell to 11.1%, lower than the 12.4% predicted by analysts. It was also an improvement over the 13.3% recorded in May 2020.
Unemployment claims filed for the first time also fell to 1427K from last week’s 1482K, but did not meet expectations of 1350K that analysts had predicted.
This NFP report signifies a second straight month of recovery for the employment market in the US. It was released a day earlier than the regular schedule due to the US bank holiday tomorrow in commemoration of the US Independence Day.
Outlook for Gold Price
This month’s report was not just about the numbers, but also about the metric known as labour participation. Labour participation increased from 60.8% in May to 61.5% in June, indicating that more people were actively seeking employment. This adds strength to the improved nature of the job’s numbers.

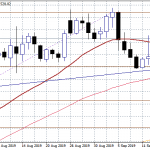
A look at gold price on the daily chart will show that the selloff is challenging the lower border of the ascending channel, as well as the 1762.51 support level. A breakdown of the channel from further strengthening of the US Dollar against the yellow metal could allow for a drop to the 1748.40 support (14 April high and 26 June low), making it the initial target. Further decline below this level could target 1721.76 as well as 1701.39 (29 April, 13 May and 15 June lows).
On the flip side, failure to breach the channel to the downside allows gold price to bounce towards the opposing border. However, this bounce must break above the 1788.90 resistance high formed by the 1 July 2020 candle, as well as the all-time highs above 1803 attained in 2011 in order to be actualized.
Gold Price Daily Chart
