

- The price of gold has risen by over 4% in under a week, as the market grows convinced that the Fed will almost certainly cut rates in June.
Gold continued with its scintillating ascent against the US dollar, as it recorded a new year-to-date high of $2133, before settling at $2130 per ounce at 10.02 am UTC at the futures market. Spot market gold followed a similar trend, rising by +0.50% to trade at $2125 at press time. The commodity has gained more than 4% since February 29th, amid growing confidence of June US interest rate cuts.
The US economy has taken some beating from the current interest rates, underpinned by lower-than-expected GDP reading in the last quarter of 2023. In addition, recent macroeconomic indicators have fallen below forecast figures. This have triggered calls for an end to the high rates by June to avoid adverse effects on the economy.
Gold price have risen on the back of expected rate cuts, as such a move would eat into the dollar’s strength. In addition, US Treasuries have fallen behind in their competition against the yellow metal, as their yields face rejection at 4.200% mark. This places gold on the driver’s seat as the market awaits high-impact macroeconomic events. The US will release its US ISM Non-Manufacturing Prices PMI, ISM Non-Manufacturing PMI the S&P Global Services PMI readings for February. The readings will be crucial to helping the dollar find stability against gold, considering Friday’s disappointing ISM Manufacturing PMI figure.

Also at play is the expected testimony of Federal Reserve Chairman, Jerome Powell. He will start his two-day testimony on Wednesday in Congress as he presents the Semiannual Monetary Policy Report. His speech will be analysed for hints on the probable decisions during the March FOMC meeting. Elsewhere, gold could make some gains from China’s economic challenges. The country’s industrial activities reduced for the fifth straight month in February, and this trend could channel some safe haven investments gold’s way.
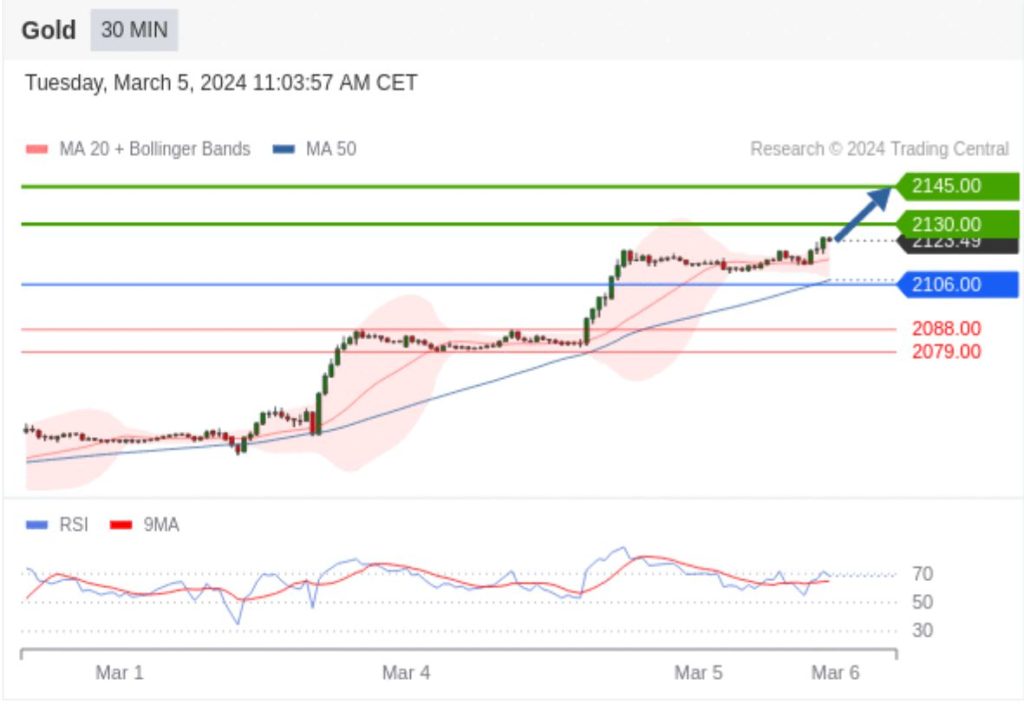
Technical analysis
The bullish RSI on the gold price chart signals more upside action. The commodity has pivoted at the $2106 price, and the bulls will target breaking the $2130 resistance. If they succeed in doing so, they will face the next resistance at $2145. Meanwhile, a slide below $2106 will put the bears in control, with support coming at $2088. Sustained control by the sellers could see the support move to $2076.