

- Gold price has made a strong recovery in the past three months as the US dollar index and VIX retreat. It jumped to a high of $1,831
Gold price has made a strong recovery in the past three months as the US dollar index and VIX retreat. It jumped to a high of $1,831, which was the highest level since June 30th. The XAU/USD pair has risen by more than 13% from its lowest level in 2022. So, what next for gold in 2023?
Central bank demand soaring
A key driver for the recent gold price action is the ongoing demand from central banks. Recent data shows that central banks are accumulating gold at the fastest pace since 1967. The data revealed that demand for physical gold rose by almost 30% in the third quarter.
There are two main reasons for high gold purchases. First, many central banks learnt a lesson following Russia’s invasion of Ukraine. They learnt that their US dollar holdings were at the mercy of the American government. The US made the unprecedented decision of sanctioning the Russian central bank.
As such, many central banks view gold as a better currency reserve than the US dollar. Besides, gold can be safely stored in central bank storage and traded in the open market easily. Ome of the top central banks that bought gold in 2022 were from Turkey, Uzbekistan, India, Qatar, and Mozambique. Russia and China also made purchases.
The second reason why gold purchases by central banks rose is because of its role as an inflation hedge. Inflation in most countries rose to a multi-year high of 9.1% before stabilizing at 7.3%. Other countries experienced high inflation as well. However, the role of gold as an inflation hedge dwindled in 2022 as since its price pulled back by 12% from its 2022 highs.
Falling inflation expectations
Gold price also recovered as inflation expectations dropped to the lowest level in months. Data published last month showed that inflation dropped to 7.3% in November. The 10-year treasury breakeven point has also dropped to the lowest level in weeks.

Therefore, there is a likelihood that the Federal Reserve will scale down its rate increases in the coming months. Analysts expect that the bank will end its tightening phase in the first quarter of the year. Some analysts have even started pricing in a rate cut by the Fed if inflation approaches its target of 2.0%.
Gold price outlook
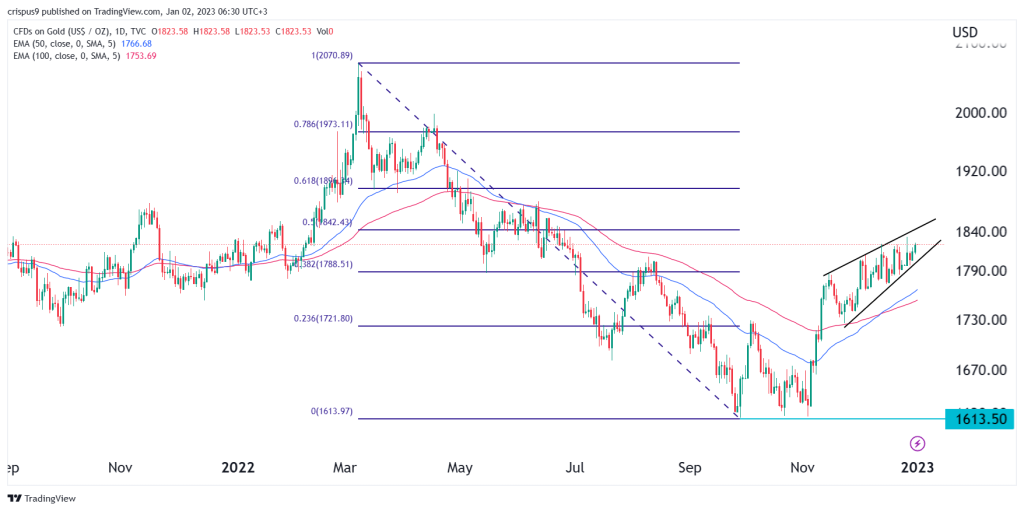
The daily chart shows that the XAU/USD price has been in a slow bullish trend in the past few weeks. In this period, it has moved close to the 50% Fibonacci Retracement level. The 100-day and 50-day moving averages have made a bullish crossover pattern.
However, a closer look shows that gold has formed a rising wedge pattern that is shown in black. This is a sign that it will likely pullback in the first quarter. If this happens, gold price will likely drop to $1,750. A move above the resistance point at $1,850 will invalidate the bearish view.