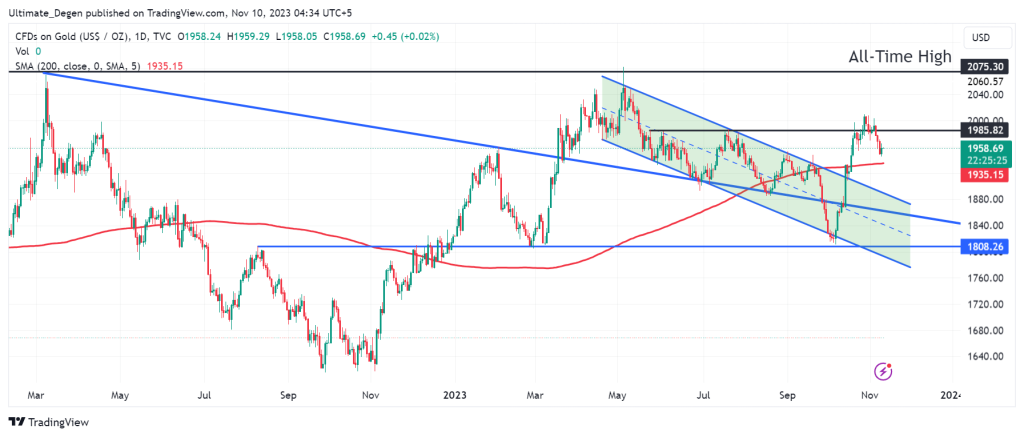
Gold Price did a fake-out above the $1985 resistance level after breaking above it in October. However, the bears took the opportunity to short the precious metal, pushing its price back below this crucial resistance. The chart below also reveals a lower low on the daily chart, which is a worrying sign for the bulls.
In October 2023, XAU/USD experienced an impressive 11% rally as investor focus shifted away from stocks and they sought refuge in safer assets like Gold and Bonds. However, the panic seems to have subsided as the yellow metal is trading 2.1% below its October high right now.
The DXY index is down 0.1% on the daily timeframe as the markets wait for Jerome Powell’s speech later today. Investor sentiment seems to be divided on whether the Federal Reserve is done with its rate hikes or not.
According to the CME FedWatch tool, there is a 90.5% probability for the rates to remain unchanged in the December FOMC meeting.
Side by side, Gold price remains prone to the monetary policies of the US Fed. In this regard, the governor Michelle Bowman has recently hinted towards a possible rate hike to curb spending in the robust US economy. Furthermore, Minneapolis Fed President Neel Kashkari further added that it’s too soon to declare victory over inflation, further strengthening the rate-hike concerns.
Gold Price Forecast
Gold price remained in the green territory on Thursday and closed at $1958 after showing minor gains for the day. The next major level to monitor will be the $1934 level, where lies the 200 MA. A breakdown beneath this level could trigger a retest of the top of the descending channel from which the price broke out back in October.
The Gold price forecast is not bearish yet but the bulls still need to break above the $1985 resistance. The 200 MA is another major indicator that may be retested in the coming days for some support.
Therefore, there are strong chances of a rebound from the $1935. A successful break above $1985 will put a retest of the all-time high for the yellow metal on the cards.
XAU/USD Analysis