

- Here is the gold price forecast following the conclusion of the Jackson Hole symposium and ahead of the NFP report.
Gold price action on the XAU/USD pair continued the slide on Monday, falling 0.64% to extend the slide, which was initiated on Friday after the Fed Chair’s hawkish speech at the Jackson Hole Symposium. In his speech at the symposium, the US Federal Reserve Chairman Jerome Powell reiterated the Fed’s desire to bring US inflation under 2%.
This opens the door for a few more aggressive rate hikes, starting from the September meeting. Higher interest rates may slow inflation, but the overriding concern will be on any recessionary risks that may follow.
This also makes Friday’s non-farm jobs report essential, as the labour market is one of the first to start feeling the pinch of any recession. A good jobs report for August, following July’s stellar performance of the US labour market, gives the Fed more room to act, and this could signal further bearishness for gold prices.
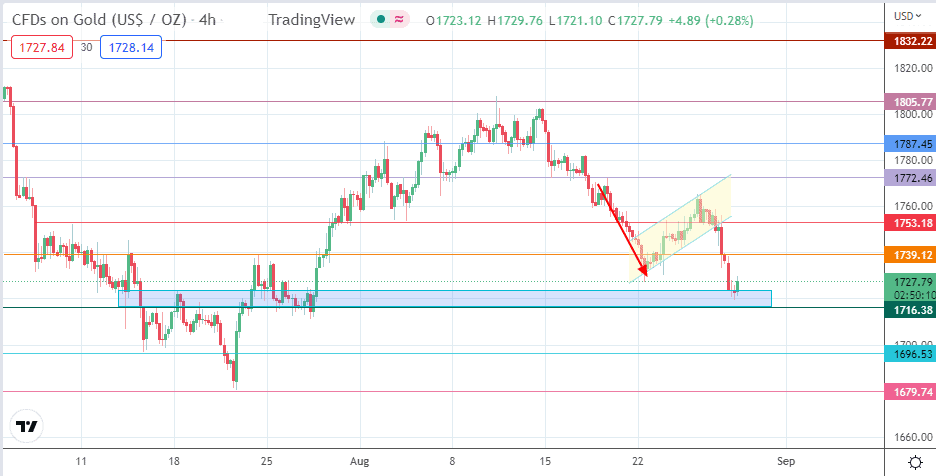
From a technical perspective, the move completes the bearish flag formation on the chart of the XAU/USD pair. Whether the decline continues will depend on the fundamental triggers for the week. Consumer Confidence and the ISM Manufacturing PMI data are news releases that precede Friday’s big jobs report.
Gold Price Forecast
The attainment of the 1716 price support completes the measured move from the bearish flag pattern. This makes room for a potential retracement bounce that aims for the 1739 resistance (22 July and 22 August highs).

Above this level, the 1753 price resistance (29 July and 24 August highs) becomes the new target to the north if the retracement continues. Any further push toward 1772 relies on the breach of the 1765 price high of the 25 August candle.
On the other hand, the bears would seek a continuation of the breakdown move. This playbook comes from rally-sell setups or a breakdown of the current demand zone between 1716 and 1723. This decline would meet an initial barrier at 1696. A further decline targets 1679, where the previous lows of 21 July 2022 are found.
XAU/USD: Daily Chart