The GBPCHF cross was hammered lately on the back of the GBP weakness. On top of that, the EURUSD strength pushed the USDCHF lower, further fueling the selling on the cross.
Once again, the 1.20 level proves to be too big a nut to crack. While the market did close above and even printed 1.21, it proved to be just a false breakout. Nevertheless, the bias remains bullish as now the cross reacted at dynamic support. For bulls that want to take a chance on the long side, there is both a conservative and an aggressive scenario to consider.
Brexit Outcome to Be Decisive
Unsurprisingly, the GBPCHF decline came as a result of how the Brexit negotiations went. The long-term consolidation that reveals a triangular pattern reflects the uncertainty behind Brexit.
There is still much to be done on the negotiations agenda, with little or no progress seen. Things turned ugly when the U.K. announced its intention to break the treaty it agreed to respect only a while ago, frustrating the E.U. In turn, the E.U. retaliates with the end of September deadline for the clearing of the Euro decision. If there is no progress until then, expect the negotiations to head towards a no-deal Brexit.
GBPCHF Technical Analysis
Like any cross, the GBPCHF moves based on the differences between the two major pairs it represents – in this case, the GBPUSD and the USDCHF. The CHF’s strength also weighed on the GBPCHF weakness due to the relentless bid for the EURUSD. Should that change, the GBPCHF cross has more room to advance than its sibling cross has to decline.
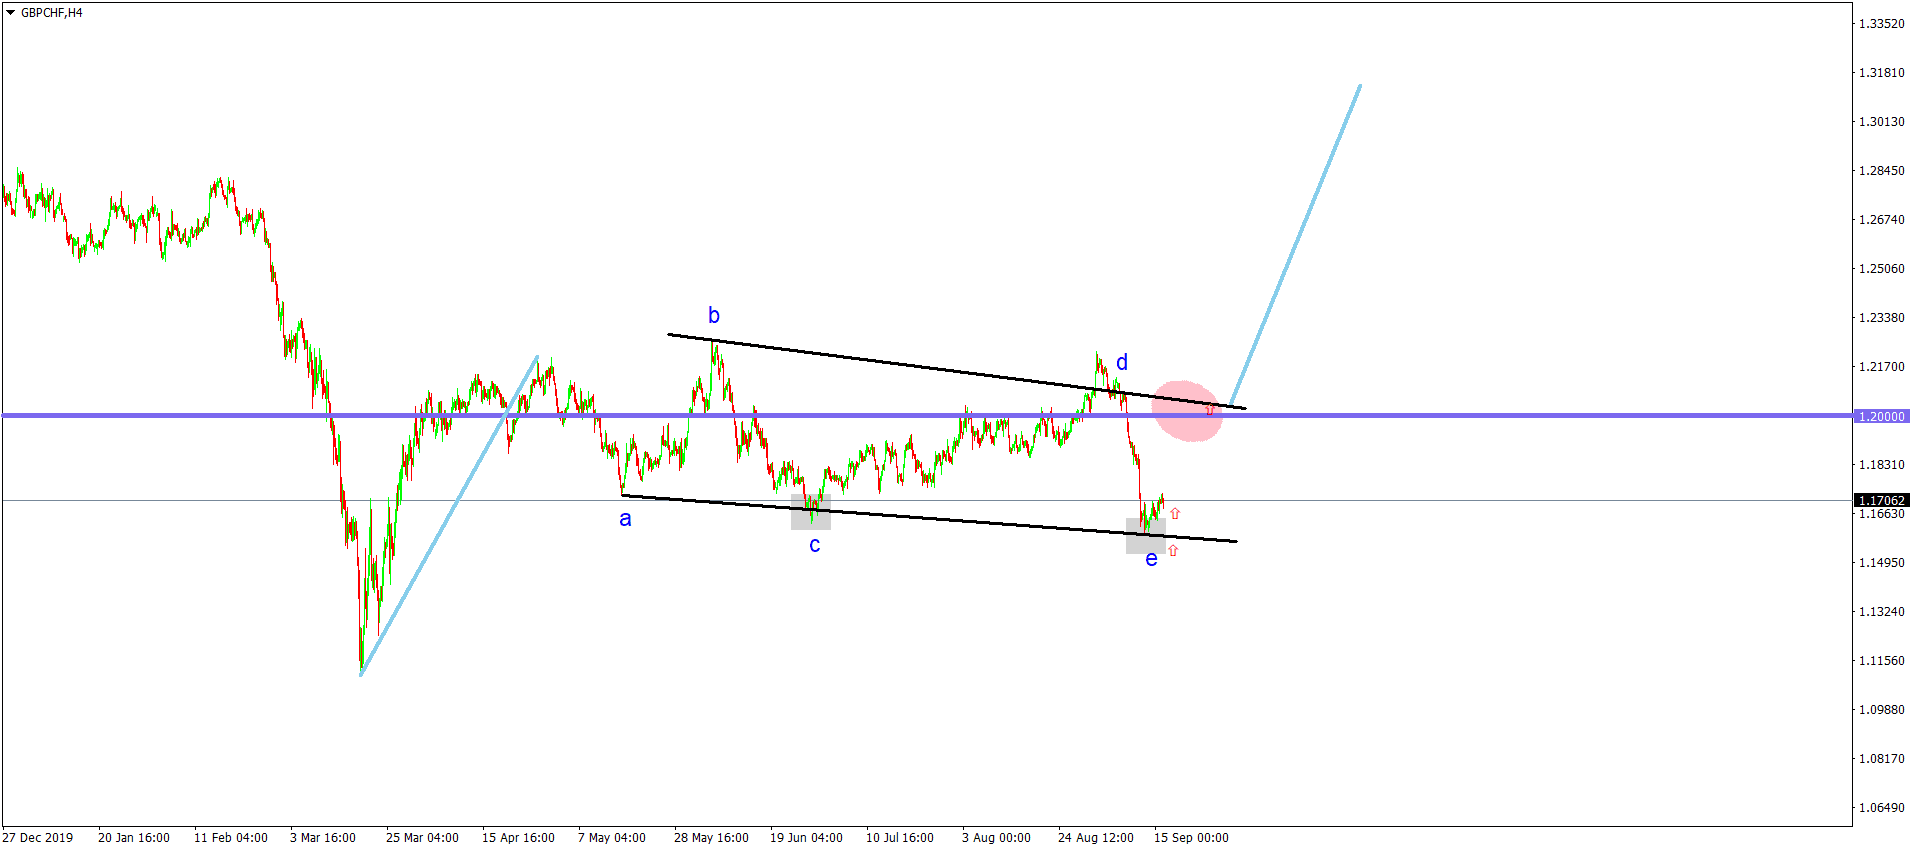
The recent move lower paints a triangle as a continuation pattern. In terms of the Elliott Waves Theory, this may be either the b-wave of a zigzag or the 2nd wave of an impulsive wave. In both cases, it points to higher values should the b-d trendline be broken.
Aggressive traders may want to trade at the market and add on a break of the b-d trendline. Conservative traders may simply want to wait for the price to break the b-d trendline before going long for the take profit and having a stop loss at the lowest point in the triangular pattern.
Don’t miss a beat! Follow us on Telegram and Twitter.
Dow Jones Daily Chart
More content
- Download our latest quarterly market outlook for our longer-term trade ideas.
- Follow Mircea on Twitter.
- Do you enjoy reading our updates? Become a member today and access all restricted content. It is free to join.