- The GBP/USD is trading higher today, but is this a true sign of strength or is this a new rally selling opportunity?
The GBP/USD pair continues to enjoy a reprieve after it crashed to all-time lows on Monday after the USD Index pulled back from recent highs. As the US Dollar pulled back and long-term US bond yields eased, the GBP/USD staged a further recovery on Tuesday, adding 1.17% on the day as it aims to pare recent steep losses that sent it to record lows.
What do the charts currently tell us? Yesterday’s dip into uncharted territory was followed by traders’ renewed buying at low prices. Furthermore, early short sellers have started to bank profits. This has presented as a hammer candle with a long shadow, followed by an engulfing bullish candle which could signal additional recovery if the economic news out of the US on the day is USD-negative.
In a week that is light on economic news out of the UK, fundamental triggers for the pair from this week’s economic calendar include the US Durable Goods and Consumer Confidence reports. There will also be a lot of Fedspeak, with Fed Chair Jerome Powell leading a discussion on digital currencies at a Banque de France event in Paris.
Powell will also be at the Community Banking Research Conference being hosted by the Federal Reserve Bank of St. Louis. This event will also feature St. Louis Fed President and notable hawk James Bullard. The Fed’s inflation barometer, the Core PCE Price Index is due for release later in the week. The GBP/USD is currently trading 1.15% higher and is up by 123 pips as of writing.
GBP/USD Forecast
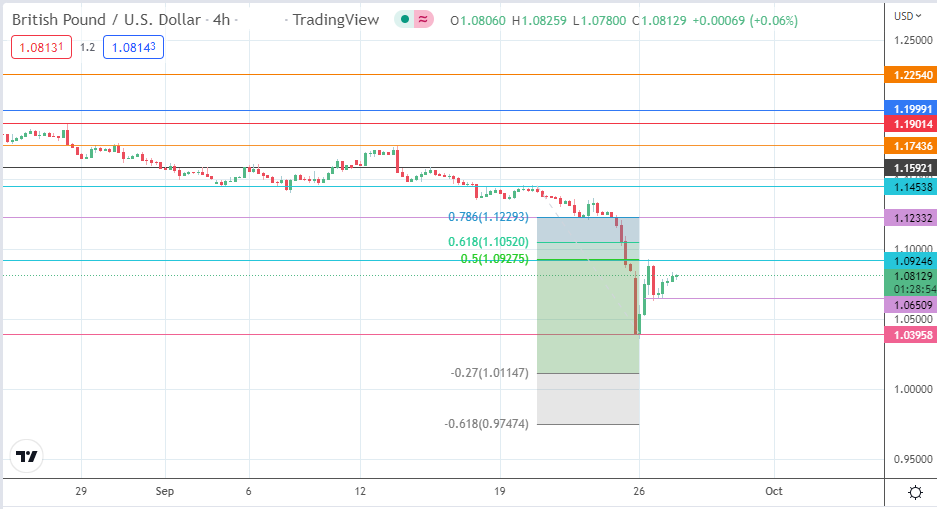
The retracement bounce from the 1.03958 support level formed by the low of 26 September 2022 is currently targeting a retest of the 50% Fibonacci retracement at 1.09246. This price level marks the 26 September intraday high.

A break to the upside allows for a further recovery that targets the 61.8% Fibonacci retracement from the 20 September swing high to the swing low of 26 September at 1.10520. Another push to the north will see the bulls make contact with the 1.12332 resistance (78.6% Fibonacci retracement and 21 September low). 1.14538 is an additional harvest point for the bulls if the corrective retracement gathers more momentum.
The retracement rally on the GBP/USD could provide new rally-selling opportunities at any of the resistance levels mentioned above. Rejection at any of these points will ultimately lead to a retest of the 1.03958 low. This will result from a breakdown of the confluence of 4-hour lows at 1.06509.
If the bears degrade the 50-year low at 1.03958, the 27% Fibonacci extension at 1.01147 becomes the next downside target. Below this level, the 61.8% Fibonacci extension at 0.97474 becomes a potential new target, consequent upon the pair breaking parity.
GBP/USD: 4-Hour Chart