The GBP/USD pair showed an excellent recovery in January. However, the price lost most of the gains in February as the dollar started to gain strength. The British pound to USD rate is on its way to closing the month with 2% loss. On Tuesday, GBPUSD rose by 0.23% at the start of the London session.
This puts the weekly gains of cable at 1.27% after three consecutive red days at the end of last week. The positive price action of the British pound can be attributed to this week’s Northern Ireland Brexit deal. At press time, the GBPUSD pair is trading at 1.209 after gaining 0.23% since yesterday.
British Pound Makes Fresh Monthly Lows
February 2023 has not been a great month for most forex pairs. Most currencies have plummeted in dollar terms and GBP/USD is no different. The recent developments have turned US Fed more hawkish. The month started with a 25 basis point hike after the FOMC meeting and then the CPI numbers also failed to impress the markets.
The final nail in the coffin was the PCE inflation which showed that inflation is still rising as per Fed’s preferred gauge. All this news generated a strong surge in DXY index as it rebounded from its 7-month lows. While GBP/USD pair has kept falling in the month, DXY is up 3.79%, indicating a strengthening dollar.
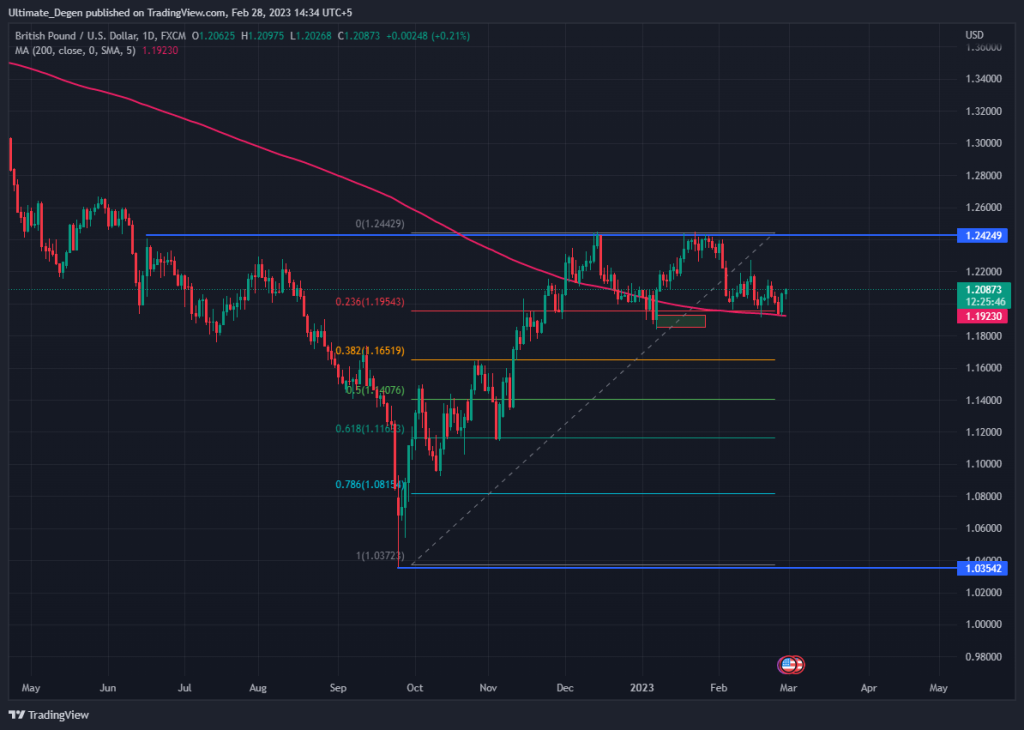
GBP/USD Price Chart 1D
After 3 consecutive green months, GBPUSD is set to close the month in the red. This comes as nor surprise as analysts are expecting 3 more rate hikes from US Federal Reserve in 2023. This means a potential 100 basis points hike from current rates. This will only make the dollar stronger in terms of other global currencies. Consequently, the British pound to USD rate will also suffer.
Technical analysis of GBP/USD pair shows that the pair has gained 16.6% since its September 2022 lows. However, the bulls are losing steam as the price has failed to break above the key resistance of 1.242.
The price is also inching closer to fresh yearly lows but getting supported by the 200-day moving average. A daily closer below 200-day MA can tank the price to the 1.14 level, which is the 0.5 fib retracement level.