
The Indian rupee has gained a lot of strength in the past few days. This has caused the GBP to INR exchange rate to drop for three consecutive days. As I mentioned in my previous analysis, the technicals were already pointing towards this drop. However, the interventions from the central bank have intensified the downtrend.
GBP/INR is down 1.7% from the monthly highs. On Friday, the pair extended its weekly losses by another 0.17%. At press time, it stood at 100.804 after a slight bounce from the daily low of 100.505. This price action is quite surprising as the British pound has been steady against the US dollar for the past few days.
For the last 12-18 months, the Reserve Bank of India (RBI) has been trying its best to stop the devaluation of the Indian rupee against the dollar. If we compare the charts of the dollar strength index and the USD/INR pair, it shows clear footprints of the RBI’s interventions.
This week’s price action of the GBP to INR pair can also be attributed to the interventions from the Indian central bank in efforts to keep its currency stable. Many analysts are referring to the aggressive RBI intervention in the spot and non-deliverable forward markets reason behind the ongoing downtrend.
GBP/USD Chart
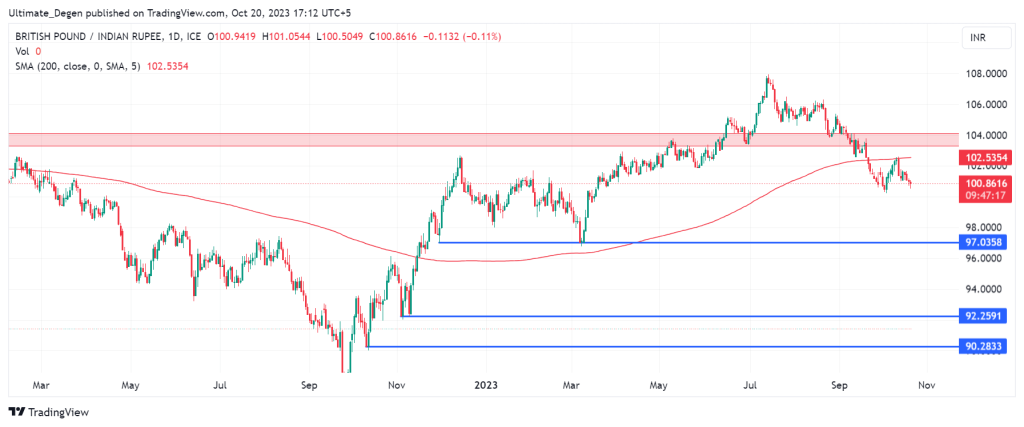
GBP To INR Forecast
The outlook on the GBP/INR chart is very bearish since the breakdown below the 200 daily moving average. If the British pound slides against the dollar in the coming weeks, a retest of the 97 support might become a reality. While the RBI’s interventions can’t be tracked or predicted, one thing is for sure that the central bank doesn’t want USD/INR to rise above 83.3.
GBP To INR forecast will most likely remain bearish until it breaks above the 200 MA and gains strength above the key moving average. Until then, a retest of the 97 level will remain in play. The next key level to watch will be the monthly low which lies around 100.22 level.