

- The FTSE 100 index is the best-performer in Europe as traders react to strong data from the UK but Brexit risks still remain.
The FTSE 100 is in the green today as traders attempt to recover some of the losses that happened last week. The index is up by 1.15%, becoming the best-performing European index today. In Germany, the DAX index has risen by 0.95% while in France, the CAC 40 has risen by 0.90%.
Housing companies soar
The FTSE 100 has risen, partly fuelled by a strong performance of companies in the housing and property sector. This is happening partly because of the impressive house price index data from Halifax. According to the company, house prices rose by 1.6% in August, beating the consensus estimate of 1.5%.
On a year-on-year basis, the prices rose by 5.2% in August after rising by 3.8% in the previous month. The rising house prices is mostly because of the rising demand due to lower interest rates.
As a result, the best-performing stock in the FTSE 100 is Barratt Developments, whose share price is up by 2.55%. Persimmon and Scottish Mortgage Trust are other big gainers, rising by more than 2%. Ashtead Group, a company that rents construction equipment has also done well.
On the other hand, NatWest, Lloyds Banking Group, and BT Group are the worst-performing stocks in the FTSE 100 today.
Surprisingly, the FTSE is rising even as the risks of a no-deal Brexit rises. In a statement last week, Boris Johnson said, “I want to be absolutely clear that, as we have said from the start, that no-deal would be a good outcome for the UK.”
At the same time, the UK is pushing the internal market bill that is aimed at streamlining trade between England, Wales, Scotland, and Northern Ireland. This document will go contrary to the withdrawal agreement that was signed in October last year.

FTSE 100 technical forecast
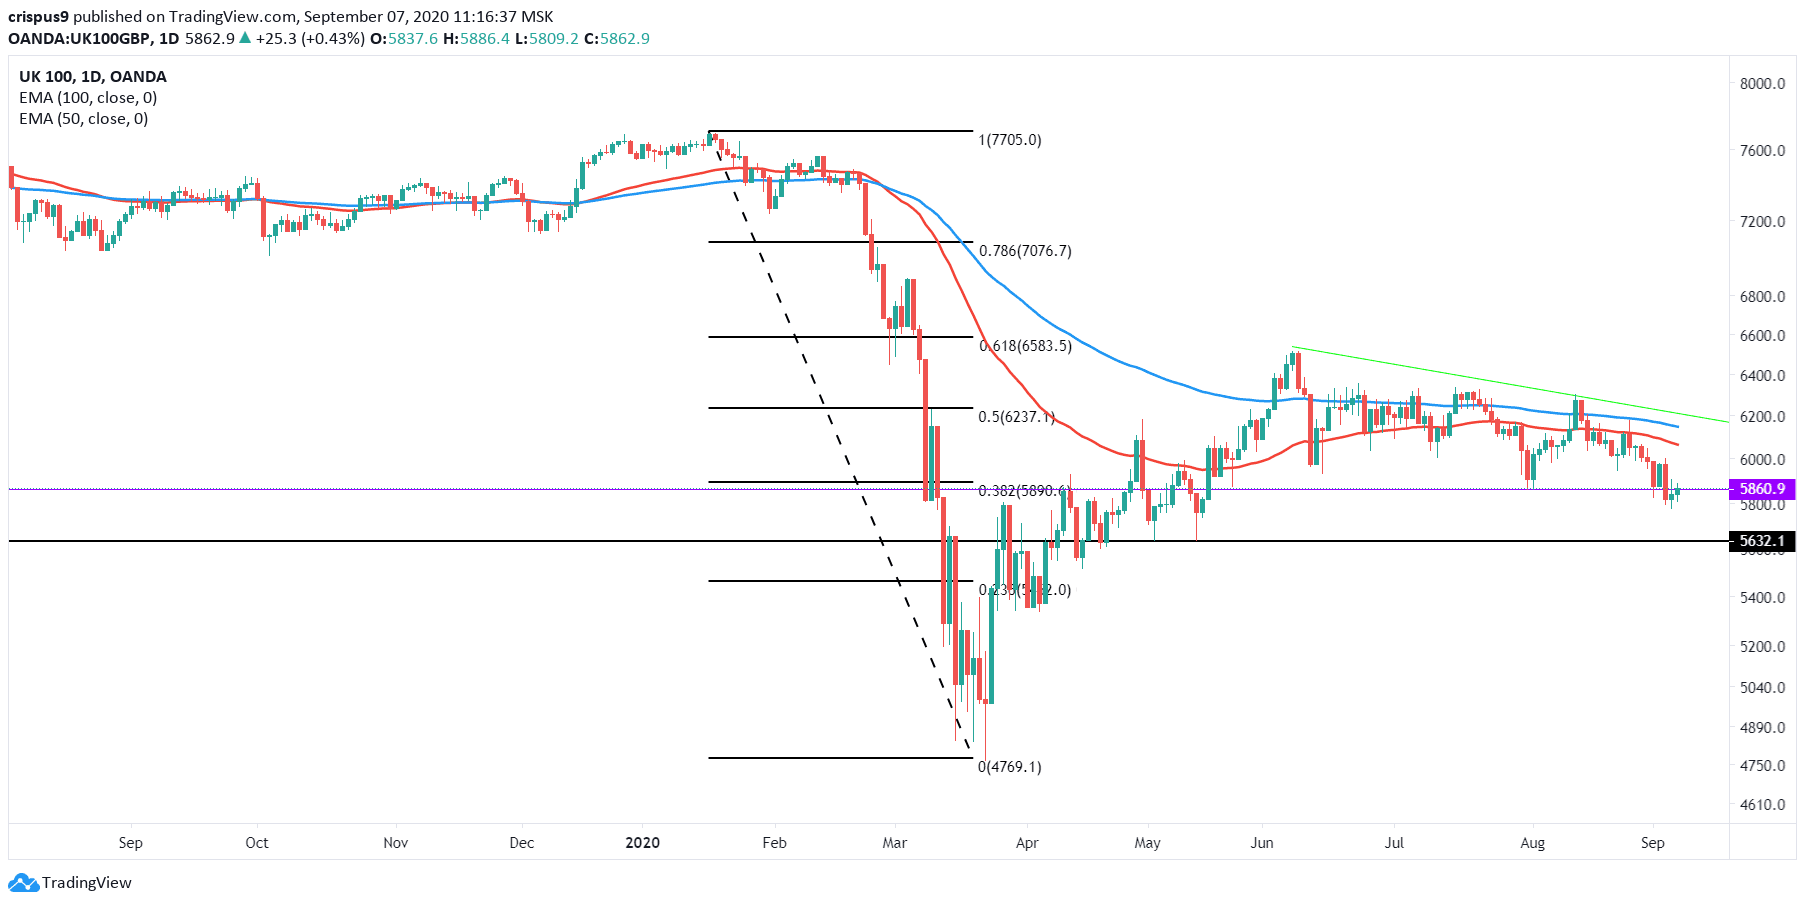
The FTSE 100 index is trading at £5,872, which is slightly higher than last week’s low of £5,768. On the daily chart, the price is along the 38.2% Fibonacci retracement level. It is also slightly below the 50-day and 100-day exponential moving averages. The price is also below the descending trendline that is shown in green.
Therefore, while the index is in its second consecutive day in the green, the bias remains bearish. If this happens, the next target will be £5,632, which is its May 4 and May 14 lows. On the flip side, a move above £6,237 will invalidate this trend. This price is the 50% Fibonacci retracement.
FTSE 100 technical chart