- The USD/ZAR forecasts for a decline in 2026 remain on track after the SARB holds interest rates steady at 6.75%
The USD/ZAR forecasts for 2026 are largely bearish, and recent price action mirrors this sentiment. The bearish move is tilted more toward dollar weakness than toward stronger fundamentals in the South African economy. Typically, emerging-market currencies such as the Rand see demand when real yields and the US Dollar are declining, as capital chases the higher risk, higher returns potential the Rand offers.
Live Chart
The USD/ZAR is trading at 15.7381, just ahead of the South African Reserve Bank (SARB) interest rate decision on 29 January. The pair is in a downtrend, having fallen steeply from the 7 April 2025 pinbar candle’s high of 19.9328. The recovery attempt stalled at 16.21 on 22 January, but the pair faltered immediately after, as the bulls were unable to regain prior highs.
USD/ZAR forecasts 2026: Macro Drivers
The macro drivers for the USD/ZAR in 2026 are:
- USD cycle (Fed easing expectations)
- SARB policy (carry trade driver)
- South Africa’s inflation regime
- EM beta (risk sentiment and portfolio flows)
- Commodity correlation (local SA risk premium)
1. USD cycle
This is the key driver of the USD/ZAR. USD/ZAR forecasts for 2026 are for the pair to decline over a softer US Dollar. Lower real US bond yields due to Fed easing expectations usually translate into increased flows into higher-yielding emerging market currencies, such as the ZAR.
2. SARB Policy
The South African Reserve Bank (SARB) decided on 29 January 2026 (a few minutes before writing) to leave interest rates unchanged at 6.75%. The Rand gained 0.26% or 171 pips versus the US Dollar in the first five minutes of the news release. This action, against the backdrop of expected Fed easing, keeps the carry differential and makes the Rand more attractive to hold. SARB policy in 2026 will depend on when the SARB decides to cut rates. An SARB rate cut reduces the carry trade support. In contrast, a rate hold maintains a reasonable interest rate differential between the currencies, which supports the Rand as a carry trade favourite.
3. SA Inflation
South Africa has a new inflation target: 3%. A survey of inflation expectations shows a cooling to 3.8%. The ZAR could benefit from a credible disinflation pathway.

4. Emerging Market FX Beta (risk sentiment and portfolio flows)
The Rand is risk-sensitive and is subject to global drivers of risk appetite. It tends to gain when geopolitical tensions ease, and with the US-South African trade relations in a dynamic hotspot, this factor could exert some influence on the pairing this year.
5. Commodity Correlations
South Africa is one of the world’s largest gold producers. Yet there is also a risk premium associated with the ZAR as a commodity currency. These risks stem from politics, policy, and labour issues in mining hotspots. Local constraints in the gold value chain could easily trigger a widening of the risk premium.
USD/ZAR forecasts 2026: Institutional Targets
Institutional USD/ZAR forecasts for 2026 provide citable targets that can help retail traders align their trades for the long term.
MUFG Research’s USD/ZAR forecast regime provides quarterly targets, as is the practice with this company. The Q1, Q2, Q3 and Q4 2026 targets are set at 16.40, 16.10, 15.80 and 15.50. ING Think also follows a quarterly forecast table, predicting that the USD/ZAR would trade at 16.75 in the first quarter, 16.50 in the second quarter, 16.25 in the third quarter and 16.00 in Q4 2026.
Base case: The base case scenario sees controlled SA inflation and a softer greenback, promoting a price drift toward 15.50 – 16.00 into the tail end of the year. This also depends on the SARB recalibrating its policy gradually, as inflation inches under the 3% target.
Bull case: The bull case scenario (ZAR-positive) sees the ZAR supported by increased emerging market flows, improvement in global risk appetite and precious metal tailwinds.
Bear case: Risk-off shocks and widening of the South African risk premium could punish the Rand. If the SARB starts to cut rates faster than expected or there is a repricing of local risk premia, this withdraws support from the ZAR.
USD/ZAR forecasts: Technical analysis
The weekly chart shows that the trend has turned bearish. The market is in decline from the 2024-2025 highs and is now challenging a significant long-term support level. Price currently sits between the 15.53 and 16.36 price marks.
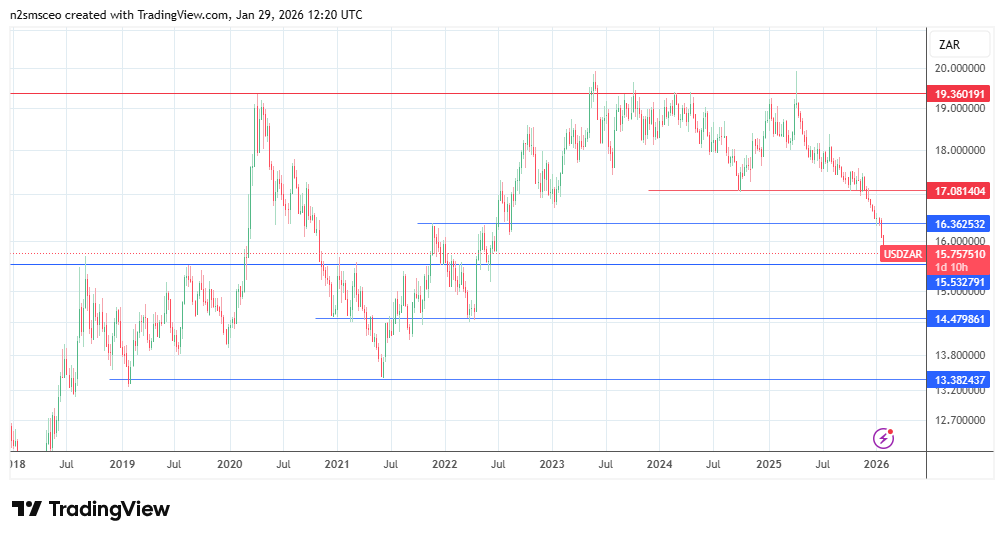
Below 16.36, the 15.53 level comes into the picture. However, this support level could hold the decline. Only if 15.53 breaks will the price move to test the 14.48 support shelf. If this bearish continuation move takes out 14.48, the 13.38 price mark becomes a viable downside target.
However, any bounce from 15.53 that fails to recover 16.36 would leave sellers looking to come in on any rallies.If the bulls recover to 16.36, a rebound to the 17.08 resistance becomes more likely. Above 17.08, the pair has the scope to rotate back to 19.36.