Archived Article This article was published more than 5 months ago. The market data, prices, forecasts, and analysis were accurate at the time of publication but may have changed since then. Please use this article for historical reference only and refer to our latest content for current market information.
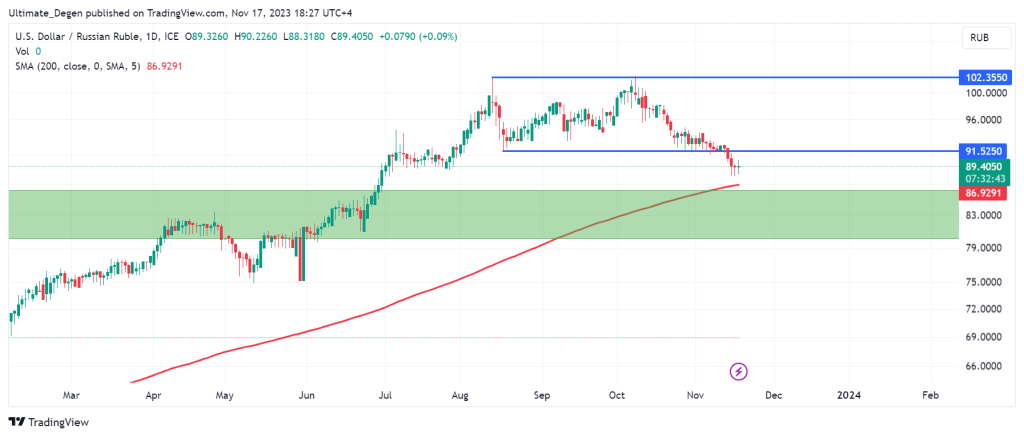
- USD/RUB is looking very bearish after the recent breakdown below 91.50. The most likely scenario seems to be a retest of the 86.16 level.
The USD/RUB pair has finally turned green after printing four consecutive red candles on its daily chart. The outlook on the forex pair remains bearish as it has broken below a key support level. This price action is due to the falling bond yields and the recent weakness in the DXY index.

The US dollar to Russian ruble exchange rate is set to post its sixth consecutive weekly loss after a strong surge in the first half of 2023. In fact, the dollar may slide more against the ruble in the coming weeks as the next demand zone lies well below the current level.
Nevertheless, USDRUB showed a 0.16% bounce on Friday. This comes despite another 0.27% drop in the DXY index. The following chart shows that the bounce occurred just a few points above the 200 MA which often acts as a dynamic support.
If you trade USD/RUB, then you should watch closely for a reclaim of the 91.50 level which was the previous range low. In case of a failure to break above this level, I expect a retest of the demand zone which lies below 86.16.
USD/RUB Outlook & Technical Analysis