Archived Article This article was published more than 5 months ago. The market data, prices, forecasts, and analysis were accurate at the time of publication but may have changed since then. Please use this article for historical reference only and refer to our latest content for current market information.
- GBP/USD has remained unaffected by the UK spring budget 2023. In the coming days GBP to USD may retest the 1.24 resistance zone.
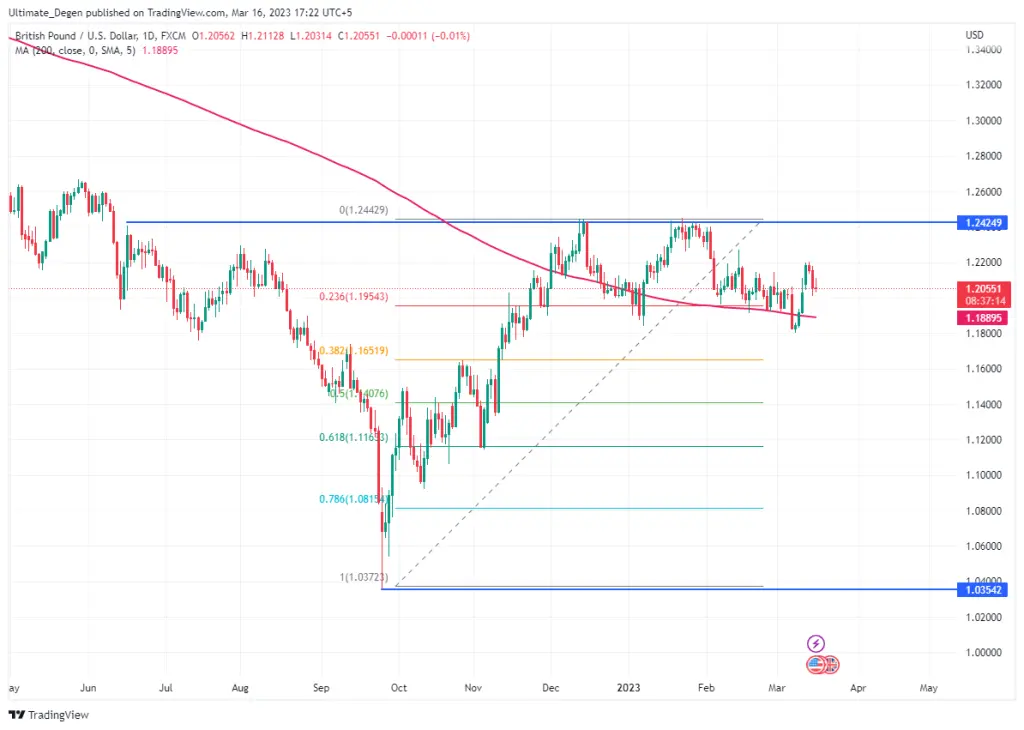
GBP/USD is gaining strength again after falling to its new YTD lows last week. After a brief price action below the 200-day moving average, the price is not trading above it. On Thursday, GBP to USD showed a positive price action during the Asian session. However, the pair lost all the gains once the British traders took control.
At press time, Pound to Dollar exchange rate is trading at $1.205 after a sideways price action. The pair is up 2% from last Wednesday’s lows and is having a minor pullback on the daily chart. The volatility is expected to increase soon as the FOMC meeting in the US approaches. The meeting which will be held next week will decide on the next rate hike.

GBP To USD Shrugs Off Spring Budget
The UK spring budget 2023 was released on Wednesday, which proposed a £9 billion tax cut for UK businesses. Nevertheless, this, together with many other positives of the budget, got offset by the concerns regarding the fate of Credit Suisse. Consequently, FTSE 100 and major UK shares dropped to their fresh YTD lows.
The sideways price action of GBP/USD comes as a surprise as the DXY index is down by 0.29%. The weakness in the dollar strength index means that the markets are expecting the Fed to remain dovish on the 22nd March FOMC meeting. If DCY falls below the 103.44 level, then I expect the GBP to USD exchange rate to soar towards the 1.243 level.
GBP/USD May Form A Tripple Top Pattern
There is a textbook bearish pattern which is known as the triple top. This pattern acts as a major reversal for asset prices. Since September 2022, GBP/USD has already attempted twice to break the 1.24 resistance level. If the DXY index keeps falling, then I expect British Pound to retest this key level once again.
Another rejection from this level will mean a formation of the triple top pattern on daily chart. This may also result in a bigger drop till the 1.14 zone, which is also the 0.5 fib retracement level. The major factor driving the GBP/USD price action in the coming days will be the amount of the next rate hike by the US Federal Reserve.