
- AUDUSD outlook is being dictated by divergence in central bank positions (RBA vs Fed) heading into the new year.
The AUDUSD may have lost some steam in Monday’s trading session, but the current technical and fundamental pictures are tilting towards dip-buying behaviour. This is visible on the charts, where the daily candle has found support at the recently broken high of 10 December 2025 at 0.6685, which is now acting as significant support.
Why is this important for the AUD/USD in the short term?
Fundamentally, the tone of the Reserve Bank of Australia (RBA) remains relatively supportive for the AUD. The latest RBA minutes, published last week, revealed discussions among board members on the need for a 2026 rate hike if inflationary risks remain elevated. This divergence from the dovish Fed creates a clearer basis for bullish optimism in AUD/USD, which traders should consider.
The underlying driver pushing broad USD weakness is the Fed’s lean towards further easing. This move has sent the dollar hovering near 3-month lows as markets price in further Fed cuts next year. This fundamental backdrop generally supports the AUD/USD.
Year-end liquidity is amplifying moves. Thin, holiday-driven liquidity, which looks set to spill into year-end, can exaggerate price swings in AUD/USD, even with a relatively thin calendar.
What this means for AUD/USD positioning today
- Traders are approaching the AUD/USD in a bullish manner, as the Fed’s lean towards further easing is weighing heavily on the greenback heading into the new year.
- In practice, the break of the long-term descending trendline visible on the weekly AUD/USD chart below is a technical trigger for further gains, with any dips seen as potential buying points.
AUD/USD Technical Outlook
The AUD/USD remains supported by the 0.6685 price mark, the recently uncapped high of 10 December 2025.
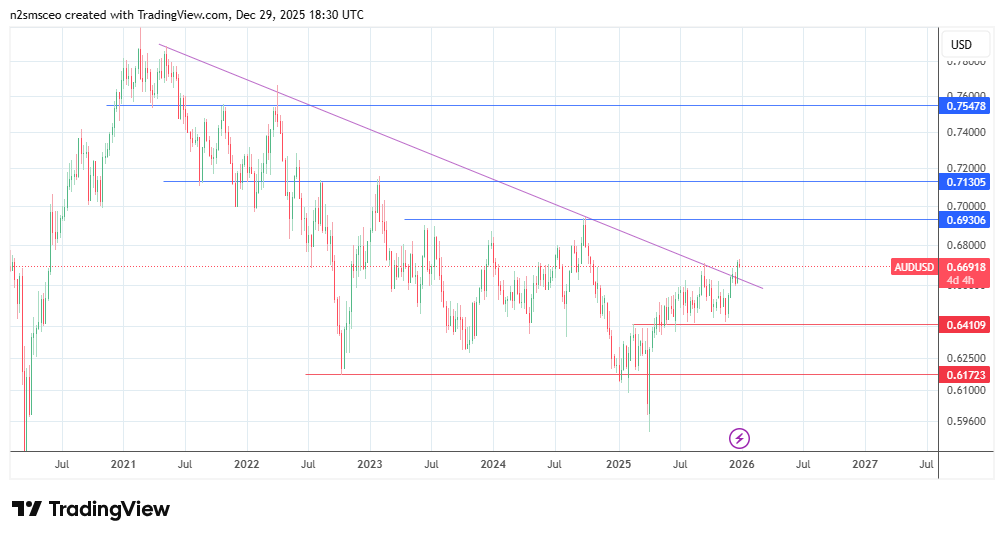
Of particular technical importance is the breach of the long-term descending trendline that has capped price highs since July 2021. This significant shift, coupled with fundamental backing, makes a case for a push off the day’s lows towards the 0.6930 resistance formed by the 30 September 2024 highs. However, the bulls must uncap the 0.6798 resistance (12 July 2024 and 23 August 2024 highs) for this move to materialize.
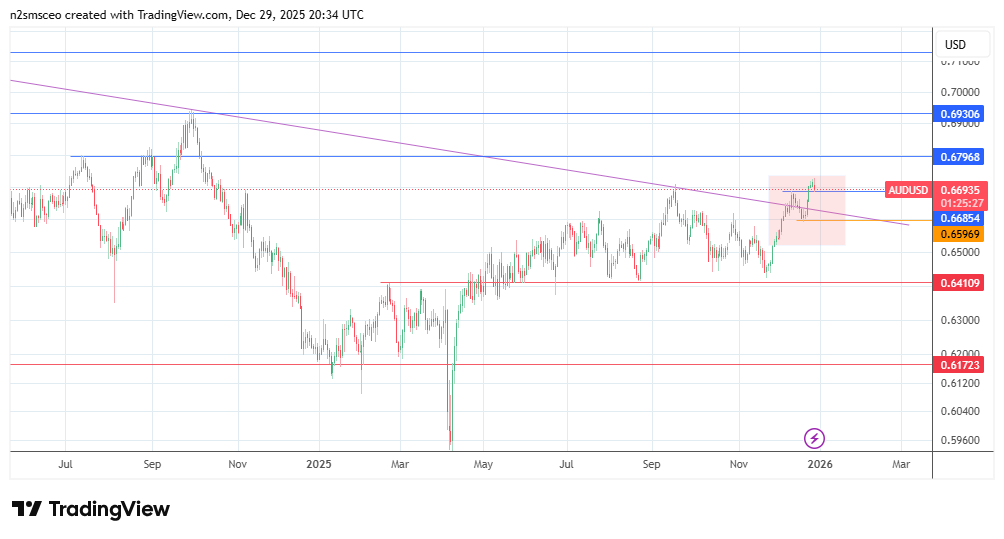
However, if the bulls fail to defend 0.6685 and the 18 December 2025 low at 0.6596, a push towards 0.6410 would be on the cards. A further descent towards 0.6172 invalidates the medium-term bullish outlook.