Fantom price appears to remain bullish despite a rough and brutal week in crypto markets. This bullish outlook is being attributed to consistently rising Total Locked Value (TVL) on the platform, which has raised investors’ confidence in the project.
Fantom was launched in December 2019 as the first DAG-based blockchain. Since then, it has grown steadily owing to its better scalability, faster transactions, and EVM compatibility. A massive rise of TVL from as low as $470 million to around $13 billion also pumped the price of its native asset FTM, which rose by 63% in January 2022.
Latest Fantom News Today
TVL data from Multichain bridge previously known as Anyswap shows that more than 55% of its TVL is coming from Fantom. This is due to the fact that investors are bridging their assets to Fantom from other chains to benefit from the high APYs being offered by top Fantom Dapps like Spookyswap, Yearn Finance, and Scream.
However, skeptics fear that the TVL might decrease significantly when the APYs on different Fantom protocols decrease.
Fantom Price Prediction
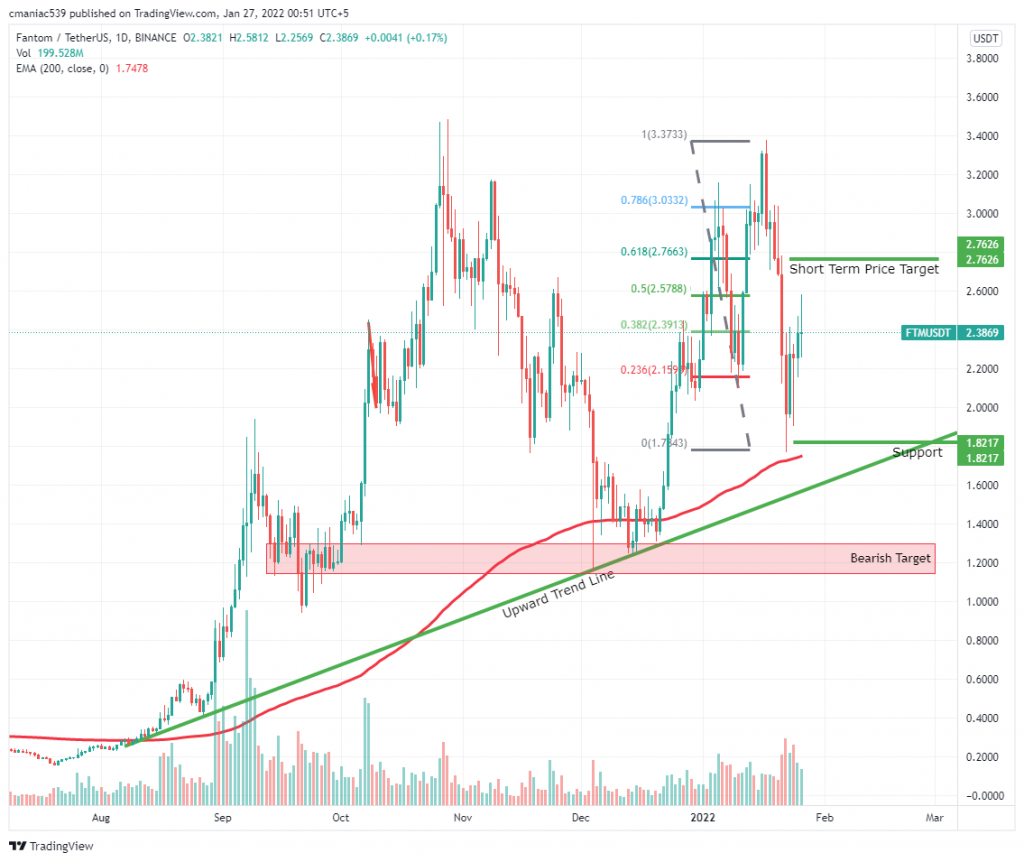
Ftm was on its way to another all-time high on January 17th, 2022 but it got rejected from its previous ATH and tanked with the rest of the crypto market. The price plummeted from $3.38 to $1.77 (a nearly 47% drop), where it found some support on the daily chart and is now trading at $2.31. The recent bounce off the $1.77 level also signifies a bounce off the 0.5 Fib level of the bullish push from July 2021 to a recent high of $3.38.
Nevertheless, the dip in Fantom price appears to have been bought up significantly as the price is still in the uptrend that started at the end of August 2022. If the bulls remain in control, the traders can target the $2.76 level which coincides with the 0.618 Fib level drawn from $2.38 high to the recent low of $1.77.
FTMUSD Price Chart
It is also to be kept in mind that any daily close below 200 EMA might send the price into further lows to test $1.10-1$.30 level.