

- EURUSD bearish engulfing pattern on the daily chart calls for lower levels. Here is a trading setup for the most important pair of the FX dashboard.
The EURUSD pair began the NFP week in a typical fashion – with a fake move. It reached below 1.17 during yesterday’s London session, only to bounce back once the U.S. stock market opened.
A risk-on market move happens when flows rotate into stocks and out of the USD. As such, the EURUSD pair caught a bid, together with GBPUSD or AUDUSD as soon as the U.S. stock market opened on Monday.
But the EURUSD daily chart shows a bearish engulfing pattern. Formed last Friday, at the end of the last trading day of the month, it offers the chance to trade the EURUSD pair with a solid risk-reward ratio.
European Fundamentals Do Not Help the Bullish Case
The enthusiasm in the Euro pairs generated by the Recovery Fund deal is behind us. Last week, the Eurozone economies took a cold shower as GDP data revealed the disaster left behind by the COVID-19 pandemic.
For the Spanish economy, for instance, the impact is almost twice as much as the one suffered by the U.S. The difference, therefore, must appear somewhere in the market. Why not on the flagship pair – the EURUSD?
Spanish banks look weak too. Banco Santander, one of the largest Spanish banks, posted a $13 billion loss in the second quarter. It may not sound like much, but this is the first loss in the company’s almost two-century long history. Other Spanish banks made new lows on the stock market in sympathy.
Lagarde keeps printing at the ECB. The balance sheet now rose to 53.3% of Eurozone GDP – a staggering amount. Moreover, the ECB’s balance sheet expanded more than the Fed’s in the aftermath of the coronavirus outbreak.

Bearish Engulfing on Daily EURUSD Chart
A bearish engulfing as a reversal pattern has two candlesticks. The second one is the most important. It must totally engulf the first candlestick’s real body, while not doing the same with the lower shadow.
To trade it, conservative traders should wait for the 50%-61.8% retracement of the entire pattern. Next, go short with a stop-loss order at the highs. Finally, set a take profit to follow 1:3 risk-reward, as Japanese candlesticks patterns often generate higher ratios.
Aggressive traders should just trade at market, keeping the money management intact.
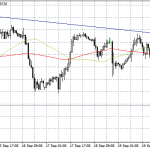
EURUSD Daily Chart
