

- On Friday, EURGBP had a strong bullish run and tapped its highest levels in three months. WIth Brexit talks expected to intensify, can it extend its gains?
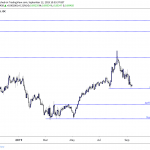
On Friday, EURGBP had a strong bullish run and tapped its highest levels in three months at 0.9099. This was after the currency pair bottomed at 0.9021. By the end of the trading week, EURGBP had settled at 0.9095, up from its opening price at 0.9025.
On the 1-hour chart, it can be seen that the currency pair has been consolidating around last week’s highs. Because this follows after a sharp rally, it can be argued that a bullish flag chart pattern has formed. When you enroll in our free forex trading course, you will learn that this is widely considered as a bullish continuation indicator. A strong close above last week’s highs at 0.9099 could mean that EURGBP would soon trade higher to 0.9147 where it peaked on September 3, 2019.
Download our Q2 Market Global Market Outlook
What could push EURGBP to new multi-month highs?
You should know that Brexit talks will come into focus this week. The UK’s chief Brexit Negotiator David Frost has reportedly landed in Brussels yesterday to begin negotiations. The pound could weaken if talks turn sour. A no-deal Brexit could put more strain on the UK economy. Therefore, such news could push EURGBP higher.
On the other hand, it’s worth noting that last week, the EU hinted at its willingness for compromise on businesses having a level-playing field. This news helped the pound attract bids because it implies that an agreement could be finalized before the end-of-year deadline.

Should the upcoming talks show more cooperation between the two parties, the currency pair could lose momentum. EURGBP may then give up some of its gains. Near-term support is at 0.9070 where it found resistance from June 19 to June 25. This price also corresponds to the area between the 23.6% and 38.2% Fib levels when you draw the Fibonacci retracement tool from the low of June 25 to the high of June 26.
If support at that price does not hold, the next support level could be at 0.9048. This price coincides with the 50% Fib level as well as the rising trendline (from connecting the lows of June 9, June 16, and June 25).