

- What is the outlook of the Ethereum price? We explain what to expect in the coming weeks as crypto rebounds.
Ethereum price rebound gained steam after Jerome Powell failed to push back against the market enthusiasm about a pivot. ETH/USDT surged to $16,95, the highest point since September last year. This rebound means that the coin has almost doubled from the lowest point in 2022. It has jumped by over 54% from the December low.
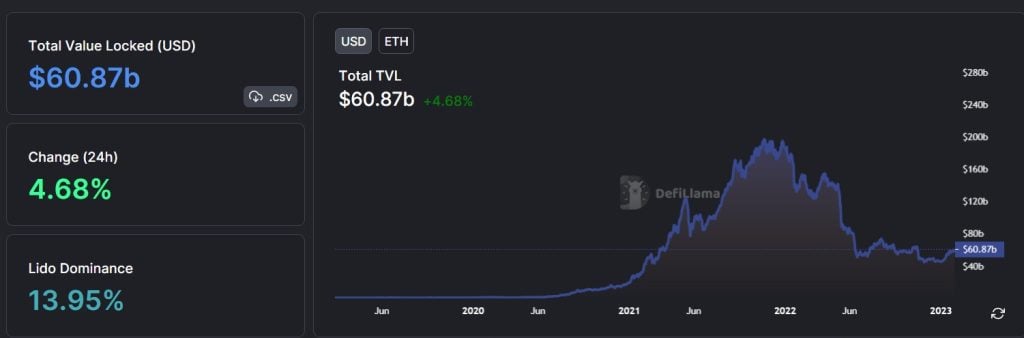
In this article, we will focus on technical analysis since the coin’s fundamentals are well-known. They include the relatively dovish Federal Reserve decision and the upcoming Shanghai upgrade that will bring millions of coins in the market. Further, Ethereum has seen the total value locked (TVL) in DeFi and NFT volumes jump in the past few months.
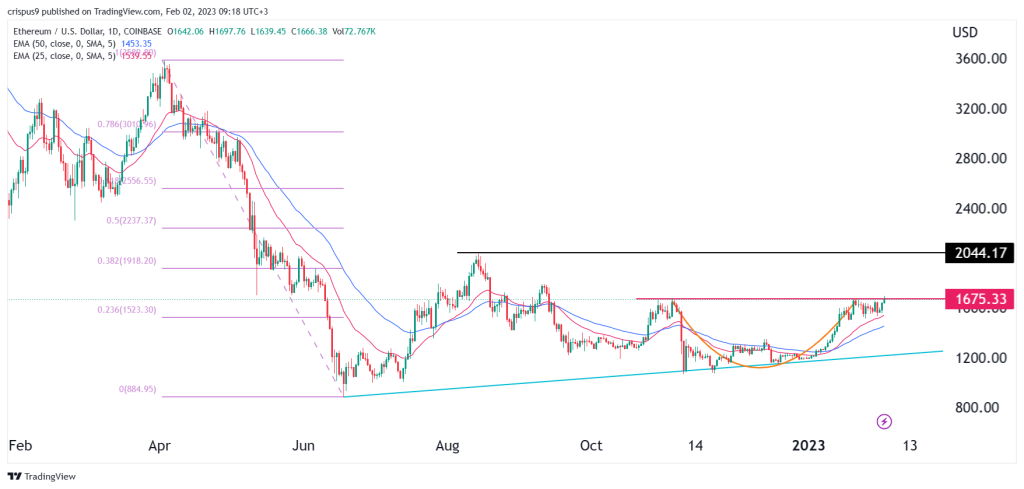
Ethereum price daily analysis
The chart shows that Ethereum price has been in a strong bullish trend in the past few weeks. It has moved above the ascending trendline that is shown in green. This trendline connects the lowest points on June 18, November 9, November 21, and December 19. Further, the ETH/USDT is trading at 1,675, which coincides with the highest point on November 5.
Ethereum has also formed what looks like a cup and handle pattern, which is usually a bullish sign. The recent consolidation is part of the handle pattern. It has also moved slightly above the 23.6% Fibonacci Retracement level. The coin has moved above the 25-day and 50-day moving averages.
Therefore, Ethereum price will likely continue rising as buyers target the key resistance level at 2,045 (August 13). This price is about 25% above the current level and is slightly higher than the 38.2% Fibonacci Retracement level. A drop below the support at $,500 will invalidate the bullish view.

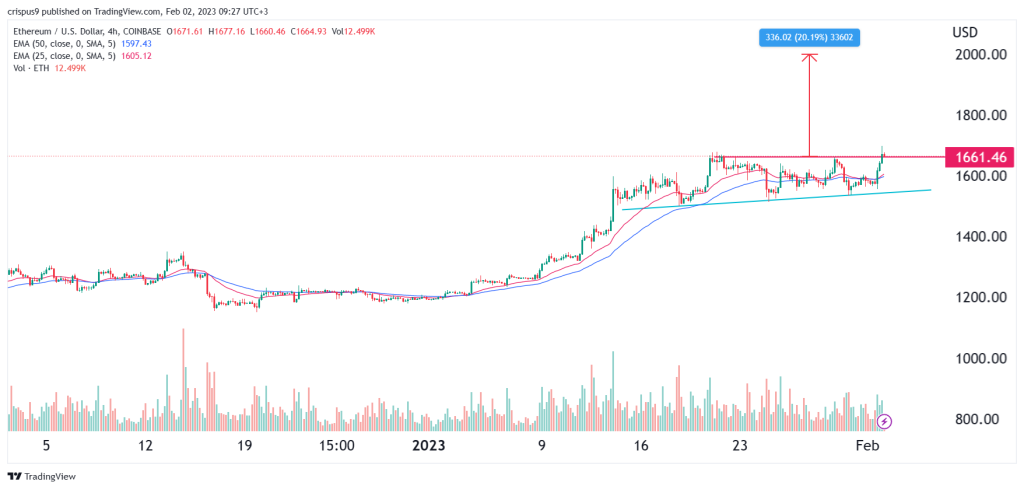
ETH/USDT price forecast 4H chart
On the 4H chart, we see that the ETH/USDT price has been in a strong comeback in the past few weeks. It managed to cruise slightly above the important resistance at 1,661, the highest level on January 29 and 22. The coin has risen above the ascending trendline that connects the lowest points since January 18.
It has also moved slightly above the 25-day MA and the dots of the Parabolic SAR indicator. However, the coin’s volume remains in a downward trend, which is a sign that this could be a false breakout.
Therefore, in the near term, I suspect that Ethereum will rise to the important psychological level at $2,000, which is about 20% above the current level. A drop below the key support at $1,500 will invalidate the bullish view.