The ETH/USD pair is down for the 4th straight day as the crypto market takes a breather from the latest bullish turn. Also, reports that UK regulators are planning to tighten crypto marketing regulations further have put a dampener on sentiment and stymied further bullish Ethereum price predictions.
In a Monday morning press release, the Financial Conduct Authority (FCA) said it was rolling out new rules on the marketing of cryptocurrencies and other investment assets it considers “high-risk” investment assets. Under the new regulations, companies must clarify all risks associated with investing in cryptos and other high-risk assets, and all incentives such as bonuses have been prohibited.
The latest rules are general, but the FCA says it will come up with crypto-specific regulations in the future. The rules come after the colossal losses suffered by crypto enthusiasts and traders in May and June 2022, with Ethereum falling by as much as 67% between April and June 2022.
Following the bearish action that followed the collapse of LUNA and the UST stablecoin, Ethereum bounced back to emerge as the top performing crypto in July. The ETH/USD pair gained 58% as interest in the token sparked bullish Ethereum price predictions. The reason for this upsurge is the upcoming upgrade from the Proof-of-Work (PoW) to the Proof-of-Stake (PoS) consensus mechanism, dubbed Ethereum Merge.
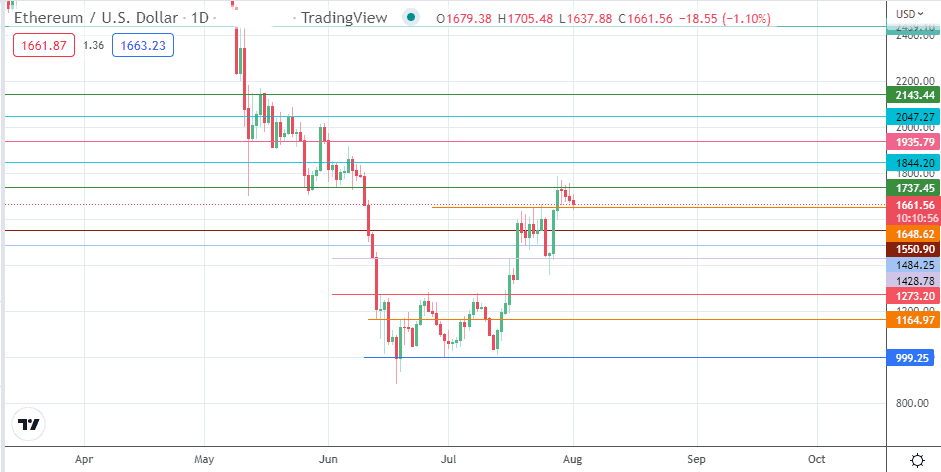
The spike in Ethereum prices peaked at the 1737.45 resistance level. This stall can be seen on the charts as a doji candle, followed by three consecutive days of bearish action on the ETH/USD. While this retracement may have put the bullish Ethereum price predictions on hold, the pair may not be out of the woods yet.
Ethereum Price Predictions
Monday’s downside move is a continuation of the correction from the recent upsurge that peaked at 1737. The price candle is now testing the support formed by the 10 June low and the 22/24 July high at 1648. A breakdown of this price mark brings the 23 July low at 1484 into the mix. 1428 is the 16 July high and 24 July low, forming the next potential harvest point for the bears before 1273 (triple bottom neckline) and 1164 enter the picture as additional downside targets.
ETH/USD: Daily Chart