


- For the Dogecoin price to return to last month's high of $0.355, it must first overcome this huge technical obstacle.
For the Dogecoin price to return to last month’s high of $0.355, it must first overcome this huge technical obstacle.
The DOGE token, by its standards, has been extremely quiet so far in November. The meme-coin is changing hands at $0.263 this morning (+1.05%) and down around 6% month-to-date. But whilst the price-action has been muted in November, October was a different story altogether.
On the 28th, DOGE jumped 26% as profits from Shina Inu (SHIB) rotated back into O.G dog coin. However, the rally hit a brick wall at the August high of $0.355 and was quickly reversed. Since then, the coin has been falling, reaching a low of $0.233 on Wednesday when Bitcoin (BTC) suddenly dropped 9%. Encouragingly, the price has stabilized and shows signs that it could be ready for another run at the $0.355 resistance. However, it will first need to close above the 200-Day Moving Average at $0.284.
DOGE price Analysis
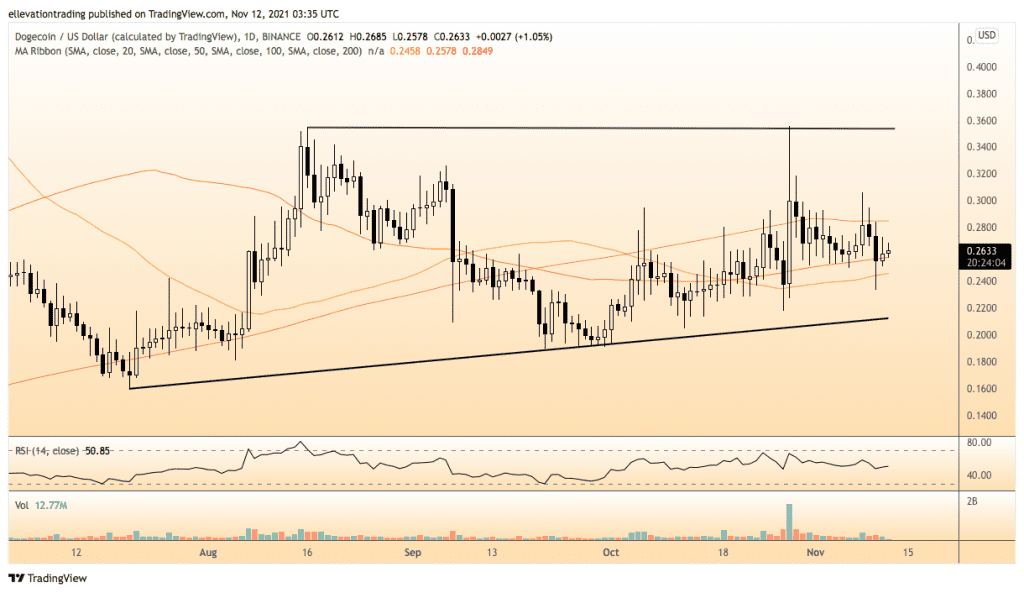
The daily chart shows the 28th of October rally was the first time Dogecoin closed above the 200-DMA since September. However, the failure at the August high sent the price tumbling back below the indicator, which is now a significant resistance level. In my opinion, if DOGE clears the 200-DMA on a closing basis, it should extend towards the $0.355 resistance. On the flip side, the longer it remains below the indicator, the higher the odds of a reversal.
Below the market, the 100-DMA at $0.258 is the first support, followed by the 50 at $0.245. I would consider a close below the 50 DMA as a bearish signal, targeting the essential trend-line support at $0.2121. Which, notwithstanding, a crypto market meltdown should hold up.

At the moment, the outlook is undecided, and on that basis, the view is neutral until the price breaches the long-term moving averages. Therefore, traders should pay close attention to the levels above for signs of a breakout.
Dogecoin Price Chart (Daily)
For more market insights, follow Elliott on Twitter.