
- The Digibyte price prediction indicates the potential for a near-term rally if the double bottom pattern is completed.
A short while ago in my last analysis on Digibyte, I presented the Digibyte price prediction, which saw the token dropping significantly from its value at the time. This Digibyte price prediction has been largely fulfilled, as the token found a new record low on 18 June. Since then, the price action has evolved to showcase a potential pattern that could lead to a short-term bullish retracement rally if the key resistance at 0.01076 gives way.
The resistance in question is the neckline of the emerging double bottom. The emergence of this pattern indicates that selling pressure has stalled. This pattern remains in evolution as long as the neckline remains intact.
Three days of consecutive bullish action has brought the DGB/USD pair to a point where this neckline is now vulnerable. An initial test on 7 July was rebuffed but another attempt is in the offing.
With Digibyte still in a medium-term and long-term downtrend, a break of this neckline could allow for the pair’s recovery. This recovery is not a reversal but a mere retracement rally. Such rallies in a downtrend are
opportunities for short sellers to gain a better price advantage in setting new entries. The price action will become clearer in the days preceding the potentially market-moving Fed decision less than two weeks away. Do not get caught in a bull trap if one plays out.

Digibyte Price Prediction
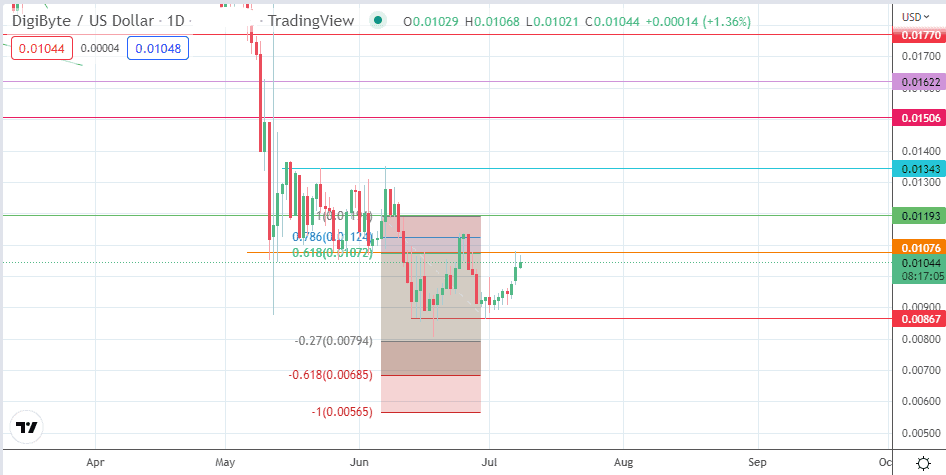
The DGB/USDT pair is testing the resistance that forms the neckline of the double bottom at the 0.01076 resistance. A break of this neckline completes the pattern, opening the pathway to a measured move that attains completion at the 0.01193 price mark. Above this level, the 0.01343 resistance (23 May and 7 June lows) and 0.01506 (22 January low) form additional price targets to the north.
This outlook is invalidated if the bears force a rejection of price action at the neckline that leads to a pullback that degrades the 0.00867 support (troughs of evolving double bottom pattern). The 0.00794 support level that appears just below the 18 June record low at 0.00805 could become the next target to the south if this low is breached. Further price deterioration could force a lower print that targets 0.00565, the 100% Fibonacci extension price mark.
DGB/USD: Daily Chart