
The US Dollar Index (DXY) staged a significant recovery during the second week of March 2026, fueled by a volatile tug-of-war between safe-haven flows and hawkish repricing. As the conflict in Iran intensifies and soaring energy prices reignite inflation fears, the Greenback has emerged as the primary beneficiary of a shifting global landscape.
In this market wrap, I analyze the technical “inflection points” for major pairs and commodities, detailing how recent inflation data has redrawn the map for the March 16 weekly open.
US Dollar (DXY) technical analysis: CPI reality check and resistance tests
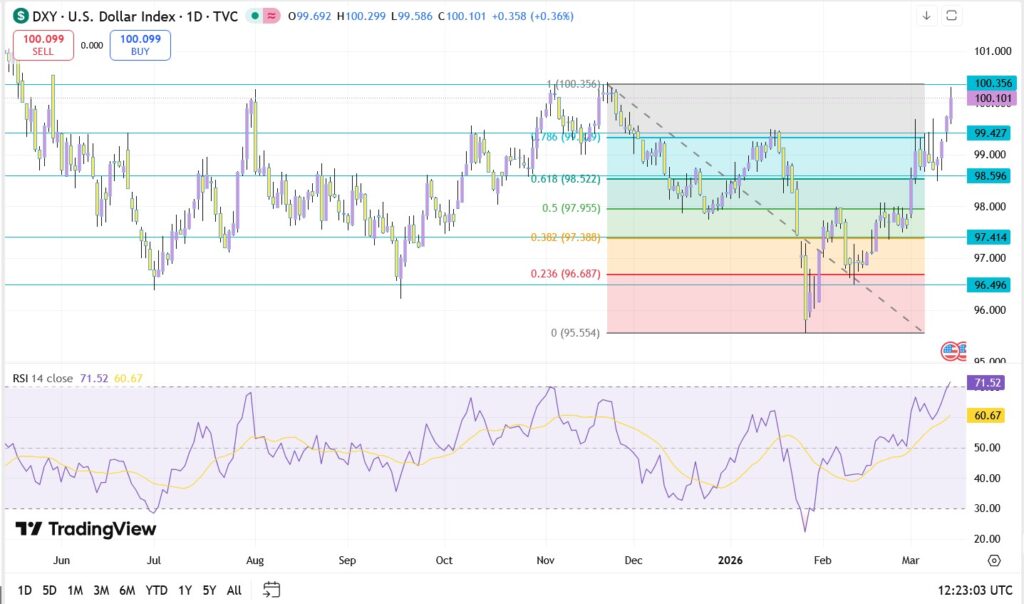
The US Dollar Index (DXY) concluded the formal trading week testing a major resistance barrier at 100.49. While Wednesday’s CPI report initially hinted at a cooling trend with a 2.4% headline print, the market quickly pivoted toward the “shadow inflation” mounting in the energy sector.
This realization fueled a late-week recovery as traders began pricing in a “higher for longer” Federal Reserve policy to combat the secondary inflationary wave caused by the $120 oil shock.
As noted by The Motley Fool on Thursday, February’s data was collected before the current geopolitical crisis:
The oil shock that sent global benchmark Brent crude to $120 per barrel on Monday hasn’t yet shown up in consumer prices… if oil stays elevated, future inflation readings aren’t likely to be so tame.”
This realization has stalled the “early-week pullback” and kept the DXY bid as traders anticipate a hawkish shift in the Fed’s stance to combat this secondary inflation wave.
DXY key technical trade levels to watch:
- Support: 98.59 – 98.69 This is the critical area where the price is expected to find buyers. It aligns with a major long-term moving average at 98.34.
- Invalidation: 97.96 As long as the price stays above this level by the end of the week, the overall trend is still pointing upward. If it falls below this, the bullish plan is cancelled.
- Resistance: 100.36 The Dollar needs to close a full day above this specific price to prove the uptrend has officially restarted.
- Next target: 101.99 If the price breaks through the ceiling, this is the next major zone we expect it to hit.
Sunday market update:
Ahead of the March 16 weekly open, the DXY has shown aggressive pre-market strength, currently trading at 100.49. This move has effectively cleared our “Next Target” zone mentioned on Friday, suggesting that the “inflation fear” trade is accelerating as investors anticipate a more hawkish Fed stance in the coming weeks.
DXY Outlook: The market has abandoned hopes for immediate easing, with Fed Fund Futures now pushing the first potential rate cut back to July. With the DXY breaking above the 100.34 resistance in Sunday’s early pricing, the momentum is firmly in favor of the bulls heading into a heavy week of central bank headlines.
USD/JPY technical forecast: Yen gains strength on safe-haven demand
The USD/JPY rally is losing steam as it hits a major resistance zone near 158.44/88. While the Dollar is fundamentally strong, the Japanese Yen has reclaimed its throne as the preferred safe-haven asset this week. Investors are moving capital into the Yen to hedge against war-related risks, overshadowing the usual interest rate differentials.
USD/JPY key technical trade levels to watch:
- Support: 157.52 This is the immediate floor. A drop below this level suggests the short-term rally is over.
- Invalidation: 157.00 This is the “make or break” point for bulls. Staying above this keeps the long-term uptrend alive; falling below it signals a deep correction.
- Resistance: 159.75 Sellers are currently defending this level. A break above it is needed to clear the path toward the yearly highs.
- Next target: 161.85 If buyers reclaim control, these are the psychological levels to watch.
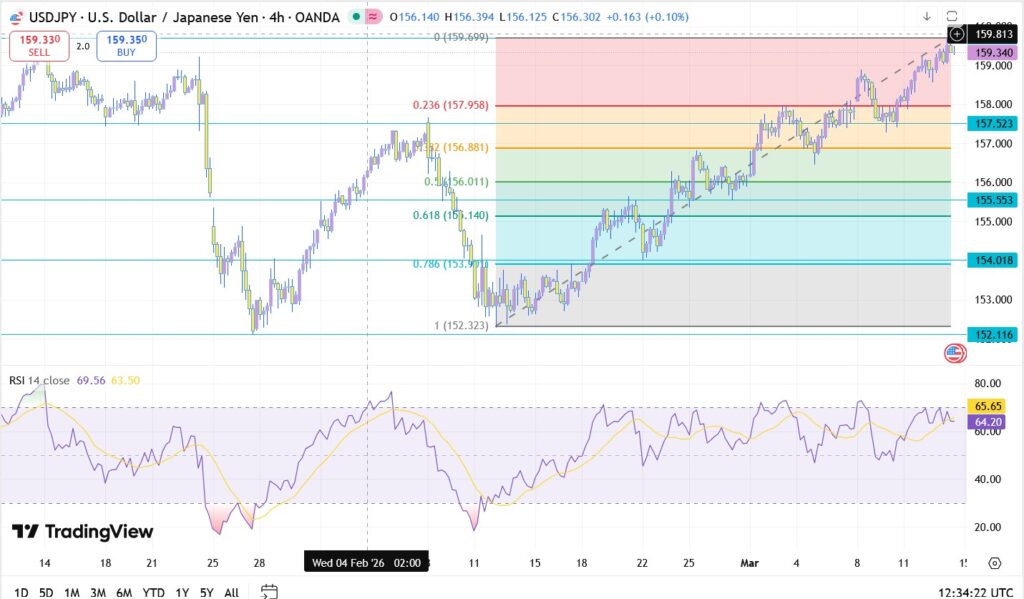
USD/JPY outlook: The immediate bias is leaning toward a pullback. Unless the pair can clear 158.88 decisively, expect further Yen strength as geopolitical headlines continue to dominate the start of next week.
Gold (XAU/USD) technical analysis: record highs meet yield resistance
Gold prices remain in a precarious position despite the ongoing turmoil in Iran. XAU/USD is hovering just above support at 5032. While the war headlines provided a massive “geopolitical floor” on Monday, the jump in US Treasury yields following the CPI report has made it difficult for Gold to sustain its rally.
Gold key technical trade levels to watch:
- Support: 5014 This is the immediate safety net. If this fails, the next major stop is the 4847 zone.
- Invalidation: 4659 If Gold falls below this level, the multi-month bullish trend is officially broken.
- Resistance: 5239 – 5243 This is the current ceiling. Gold needs to clear this March opening range to regain momentum.
- Next target: 5416 A daily close above this zone is required to ignite a fresh run toward all-time record highs.
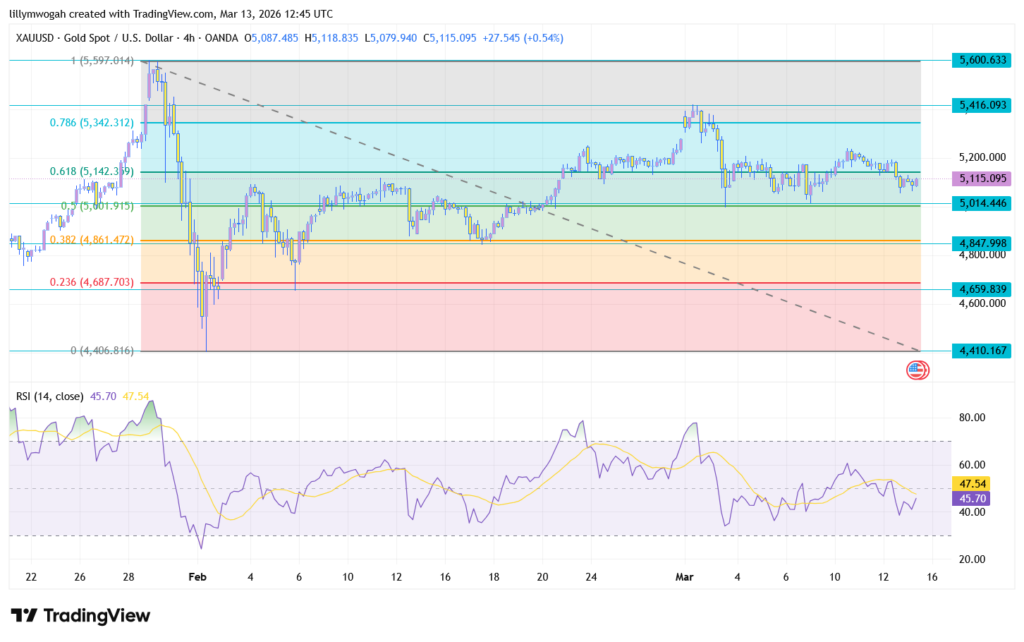
Gold outlook: The outlook remains constructive due to war risks, but the metal is vulnerable to a deeper pullback if the US Dollar continues to strengthen. Watch the 5032 level closely at the Monday open for direction.

GBP/USD technical update: cable under pressure at critical pivot
GBP/USD is trading with high caution, ending the week struggling near the 1.3224 handle. The pair is being squeezed between a hawkish Bank of England trying to get ahead of energy inflation and a US Dollar that refuses to give up ground.
GBP/USD key technical trade levels to watch:
- Resistance: 1.3483 This is the primary defense line for sellers.
- Invalidation: 1.3533 A break above this level shifts the medium-term trend from neutral to bearish.
- Support: 1.3199 This is the current “sell zone.” Buyers need to push past this to shift the momentum back in their favor.
- Next target: 1.3112 If the pair can clear the 1.3710 hurdle, this is the next major objective for the bulls.
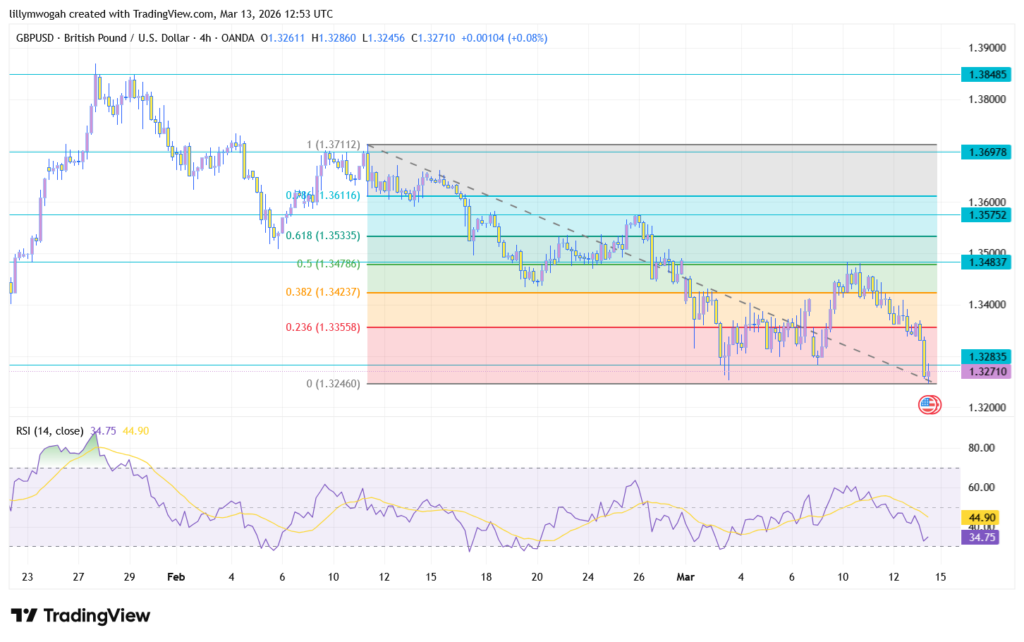
GBP/USD outlook: The “Cable” is currently in a holding pattern. Until we see a break of the 1.3650 pivot, expect range-bound volatility with a slight downside bias as the energy shock continues to weigh on the UK outlook.
Forex weekly market recap EUR/USD, USD/CHF & market sentiment
The Euro and Swiss Franc have reflected the broader market’s flight to the Dollar, though with differing levels of resilience.
EUR/USD analysis: Euro buckles under energy shock and dollar dominance
The Euro experienced a relentless sell-off this week, decisively breaking through the 1.1500 psychological handle to hit fresh year-to-date lows at 1.14740. The price action was dictated by a “perfect storm” of bearish factors: a resurgent US Dollar fueled by CPI data and a deepening energy crisis at home.
By Tuesday, the pair had already breached its 50-day moving average, and the subsequent failure to reclaim the 1.1550 level confirmed that sellers have shifted from a “sell-the-rally” to a “sell-the-breakout” mindset.
As a net energy importer, the Eurozone remains uniquely vulnerable to the $120 oil shock, which is actively dampening growth prospects and forcing a hawkish yet painful repricing of ECB expectations
- Key resistance: 1.1511
- Key support: 1.1414

Euro outlook: The immediate outlook for the Euro remains bearish as we head into the March 16 open. The market is now pricing in a stagflationary scenario for the bloc, where high energy costs keep inflation sticky while industrial production slows. Unless we see a significant de-escalation in the Middle East, the 1.1400 support level is the next logical target for bears.
USD/CHF & global market sentiment: the “inflation monster” returns
The Swiss Franc has largely underperformed its safe-haven peer, the Yen, with the pair trading at 0.78710 as the week closed. While the Yen saw massive inflows, the “Swissie” remained tethered to the broader Eurozone energy concerns.
The price action currently reflects a stalemate; however, a decisive break below the 0.7825 support would suggest a late-stage flight to quality, while a push back above 0.7950 resistance would confirm the Dollar’s dominance over the low-yielding Franc.
- Key resistance: 0.7950
- Key support: 0.7825

USD/CHF market sentiment: The overarching mood across global desks remains one of extreme caution. With Brent Crude volatile near $90-$120 and global equities posting a second consecutive week of losses, risk appetite is near multi-year lows.
Strategic outlook for the March 16 weekly open
As we transition into the March 16 weekly open, the market focus shifts to a massive slate of central bank decisions and the highly anticipated January Personal Consumption Expenditures (PCE) data. With energy prices at multi-year highs, these PCE prints will serve as the ultimate arbiter of the Federal Reserve’s next move.
However, the Fed is not alone; we are entering a “Central Bank Bonanza” with rate decisions expected from the Federal Reserve (Wednesday), the Bank of England (Thursday), and the European Central Bank (Thursday).
Traders should pay close attention to the following key events:
- Fed rate decision (March 18): Markets widely expect a hold at 3.50%–3.75%, but Chair Jerome Powell’s press conference and the updated “dot plot” will be scrutinized for a hawkish pivot.
- ECB governing council meeting: Watch for a keynote from Pedro Machado on Wednesday for clues on how the Eurosystem is bracing for the energy shock.
- BoE monetary policy summary: The “Cable” will be sensitive to any shift in the 5-4 vote split seen in February, especially following the recent breach of the 1.3320 level.
Final conclusion: The US Dollar breakout is no longer just testing resistance it is actively redefining the 2026 price floor. Heading into the week of March 16, the focus remains on whether the DXY can sustain its momentum above the 100.34 handle. Traders should stay nimble, watch the early-week closes for confirmation of these Sunday gaps, and prioritize capital protection as volatility remains at multi-year highs.
