- The Decentraland price prediction will be determined by the outcome of the rectangle pattern's price action.
The Decentraland price prediction in the near term will be determined by the price picture on the 4-hour chart. This chart shows the price action in no man’s land, trading within the confines of a rectangle pattern whose borders are defined by the highs and lows of the current week. A brief trip below the 1.000 price mark during Tuesday night’s crypto selloff was very brief.
Price action has primarily remained above the unitary level but is barely hanging on. The Metaverse tokens are well off their previous highs, created when Facebook’s rebranding to Meta created a buying wave that took these tokens to new all-time highs. Some of them are now less than a tenth of these highs, with the MANA/USDT pair down nearly 86% from its 25 November 2021 high.

It would appear that the Decentraland price predictions may also be determined by what happens on the BTC/USD pair. On Tuesday, Bitcoin dropped from 31800 to 30400, creating a brief selling storm. The MANA/USDT pair did not get the worst end of the stick, and maybe a recovery in Bitcoin prices above the 34K mark may start off a rally. But until then, Decentraland remains in a range. The outcome of this range is where the Decentraland price predictions of day traders should be focused.
Decentraland Price Prediction
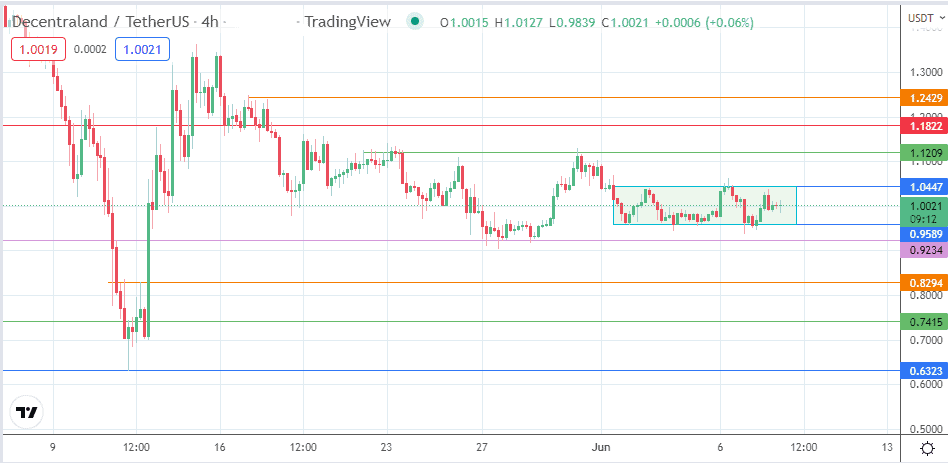
Here is the 4-hour chart and the possible playbooks. The price action of the last two days is stretched into a range. The rectangle pattern so formed has 1.0447 as the ceiling and 0.9589 as the floor. A break to the upside brings 1.1209 (31 May 2022 high) into the picture as the initial upside target. Above this level, additional marks to the north are found at 1.1822 (17 May low) and 1.2429, where the 17 May 2022 high sits pretty.
On the other hand, if the bears seize the initiative and degrade the support level at 0.9589, then the 0.9234 price mark becomes the next target for the bears. Below this level, there is a wide sea to swim in, with the bottom seen at the 0.8294 price support (12 May high). 0.7415 and 0.6172 (12 May 2022 low) are potential downside targets which become viable on extensive price deterioration.
MANA/USDT: 4-hour Chart