

Bitcoin (BTC): Holding $105K, But It’s No Victory Lap Yet
After printing fresh highs in May, Bitcoin hasn’t exactly been explosive lately. As of writing, BTC trades near $105,454, slightly off its weekly high. Still, for a coin this size, holding above $105K isn’t a bad look.
The structure right now? Choppy. Tight. You can almost feel the market watching itself. Traders are defending the $104,000 area, but no one’s rushing in just yet.
- RSI is firm at 65.19 – leaning bullish, not extreme.
- MACD just flipped green again, hinting that buyers may be testing waters.
- Smart money still nibbling: Whale wallets (100–1,000 BTC) have quietly scooped up thousands of coins across June.
That said, until we see a clear break above $106,800, it’s just speculation. If sellers take control, BTC could quickly revisit the $103K–$104K region, and that’s a psychological minefield.
Bitcoin Chart Analysis:
- Support: $104,200, $103,100, $100,000
- Resistance: $106,800, $108,000, $110,300

Ethereum (ETH): The Rebound Is Slow, But It’s There
Ethereum’s not making headlines, but it’s hanging on. At $2,501, ETH is doing just enough to suggest the worst might be behind it… for now.
You’ve got a tug-of-war happening between support and resistance. $2,426 to $2,500 has become a kind of no-man’s-land where bulls and bears keep circling each other. Above that, $2,555 remains the line to beat. That zone has repeatedly blocked upside pushes, and until ETH can clear it, we’re in stall mode.
The RSI at 55.94 is unremarkable, not overbought, not oversold. The MACD, though, just turned green. It’s not a breakout signal by itself, but it’s a shift in tone.
ETH Chart Analysis:

- Resistance: $2,555, $2,719, $2,815
- Support: $2,426, $2,320, $2,100
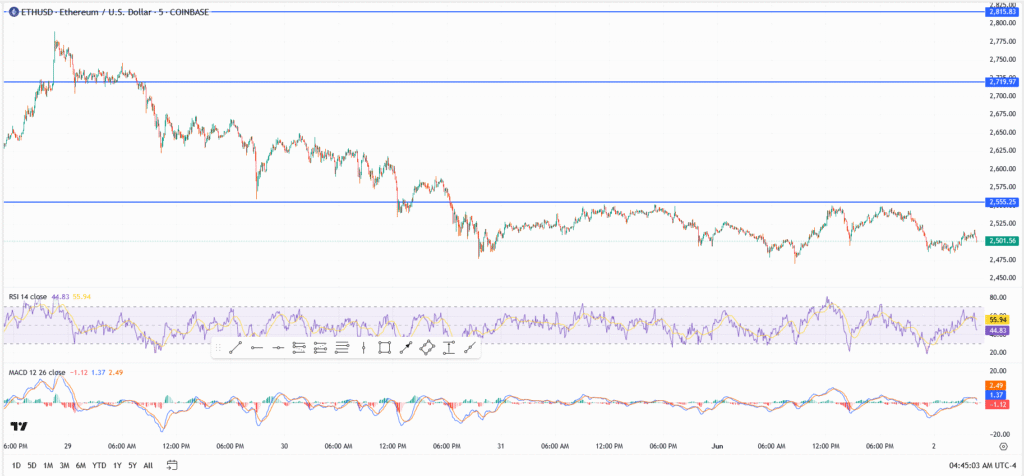
If ETH gets a volume surge and punches through $2,555, we could be looking at a fast move toward $2,700. But another rejection there might mean more slow chopping through early June.
XRP: Volume Drops, But Support Holds, For Now
Ripple’s doing what it does best lately, going sideways. The price is sitting at $2.1748, barely moving but not collapsing either. That might not sound exciting, but flat price action often precedes a move. The big question is which way.
The RSI reads 60.50, and MACD has a slight bullish tilt, but it’s not explosive. There’s still some buying pressure, but it feels more like gentle accumulation than strong conviction.
There’s also less noise lately. That could be good accumulation phase or bad lack of interest. Traders are watching $2.20–$2.22 closely. If XRP can clear that zone, momentum might kick in.
XRP Chart Analysis:
- Resistance: $2.22, $2.28, $2.36
- Support: $2.14, $2.08, $1.94
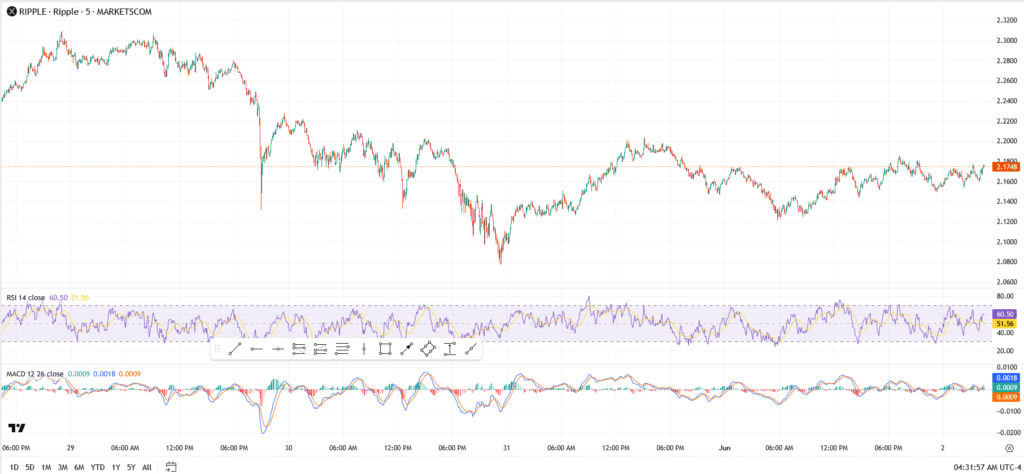
If support near $2.14 holds and broader market sentiment lifts, XRP could quietly climb its way back toward $2.36. But without fresh demand, the coin risks slipping back into its $2.08–$2.14 base.
Final Word
The start of July doesn’t feel explosive, not yet. But under the surface, something’s building. Bitcoin’s bounce off $105K gives bulls some breathing room. Ethereum is showing just enough strength to keep the uptrend hope alive. And XRP is quietly positioning for whatever comes next.
Don’t mistake stillness for weakness. If these majors clear their resistance levels, July could shift fast, and traders who are already watching key zones may be the first to catch the move.