Archived Article This article was published more than 5 months ago. The market data, prices, forecasts, and analysis were accurate at the time of publication but may have changed since then. Please use this article for historical reference only and refer to our latest content for current market information.
- Ethereum Price Prediction: Our analysis reveals how ETH to USD pair can slide below $1350 within the next few weeks.
Our Ethereum price (ETH-USD) analysis suggests that the price can dip below $1350 if it closes below a key level. Cryptocurrencies are in a slump once again as Bitcoin price is struggling to break above $22,000. On Thursday, till press time, most altcoins are showing minor gains as ETH to USD keeps on trading sideways.
Ethereum price prediction is not looking bullish as it failed to break above key resistances. The price received multiple rejections from the $1700 level in February and is trading much below that level. At press time, ETH is trading at $1538, which is 11.7% below its February highs.

CFTC Chair Calls Ethereum A Commodity
The Chair of Commodities Futures Trading Commission, Rostin Benham, has recently called Ethereum a commodity in front of US senators. The comments come as the SEC Chair Garry Gensler tightens the screws around cryptocurrencies, terming them ‘unregistered securities’.
However, the latest comments from Rostin Benham are a breath of fresh air for crypto holders. The CFTC Chair agreed with the views that crypto stablecoins should be regulated but also opined that he considered their commodities. This can make the status of Ethereum and stablecoins a bone of contention between the top US regulators, i.e. SEC and CFTC. The US Securities and Exchange Commission has recently blamed Binance US for offering unregistered securities.
Ethereum Price Technical Analysis
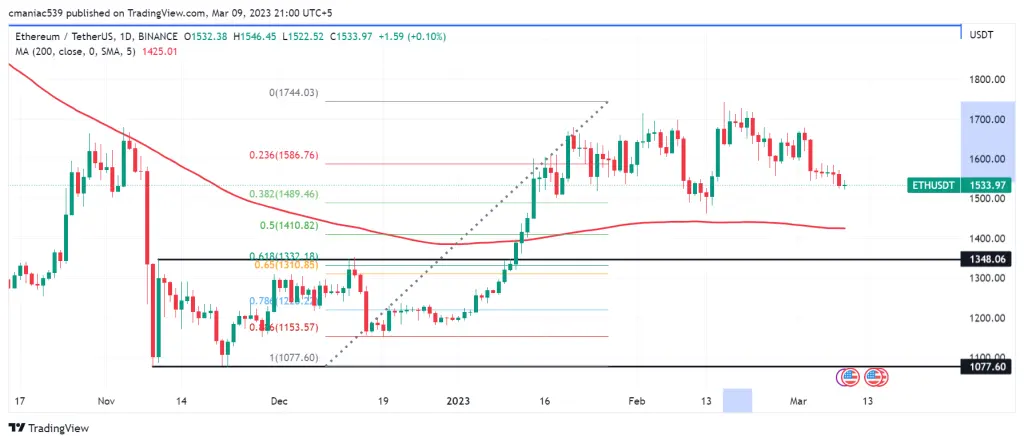
ETH to USD chart shows key levels of demand and supply. These levels are also known as the support and resistance levels. The following chart suggests that there is a strong supply zone in the $1680-$1750 region. This was the same region from which the price retraced last month.
At the moment, Ethereum price is trading above the 200-day moving average. Considering the current Bitcoin price action, I won’t be surprised if the price breaks below it. A daily closure below the 200-day moving average will make the Ethereum price prediction of $1330-$1348 a reality. This level comes from the confluence of Fib golden pocket and a previous resistance that can now act as a support.