
- The Cro price prediction will depend on the outcome of the symmetrical triangle on the 4-hour chart of the CRO/USDT pair.
The CRO/USDT pair is trading virtually unchanged, which may be considered a good thing in a bearish environment. However, the environment does not favour Cro price predictions…at least not yet. This is despite the news that the exchange was launching a startup accelerator program to be known as the Cronos Accelerator Program.
The initiative will allow pre-seed companies to access mentorship, capital and the right network of investors and business associates to get their projects moving. The program will cover projects that deliver solutions in web3 gaming, the metaverse and advanced decentralized finance.
Ordinarily, such news could have triggered a bullish response on the CRO/USDT pair. But in the current environment where adverse conditions prevail, nothing of the sort has happened. Price action will only respond to a change in market sentiment. Until then, the Cro price predictions will be determined by the technical picture on the charts. Here is how the 4-hour Chart will dictate the Cro price prediction outlook in the near term.
Cro Price Prediction
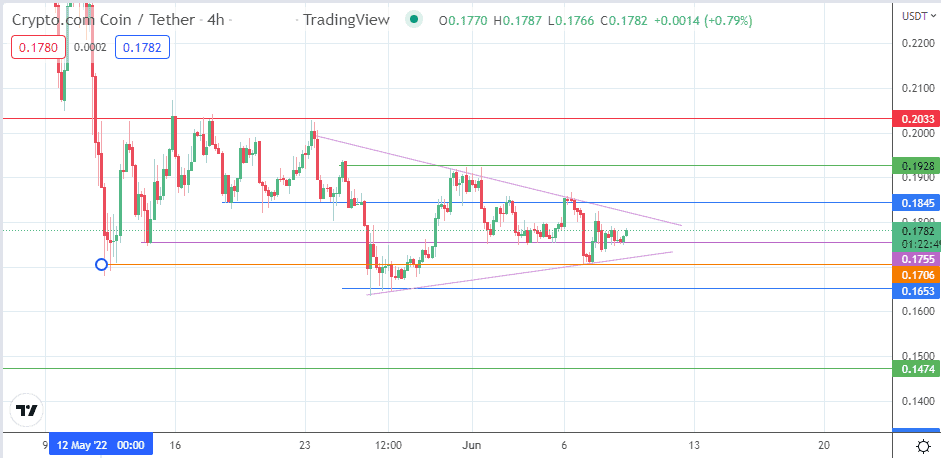
The 4-hour Chart reveals several levels of support and resistance that will determine price action in the near term. The symmetrical triangle remains in evolution, with the price action bouncing from the 0.1755 minor support (4 June low). This bounce must gather momentum to test the 0.1845 resistance (3 June high), which intersects the triangle’s upper edge.

A break of this resistance also breaks the triangle to the upside, targeting a measured move at 0.2033 (17 May high). To attain completion, this breakout move must uncap the resistance barrier at 0.1928 (1 June high).
On the other hand, a decline below 0.1755 invalidates the previous outlook. This decline allows the bears to test the triangle’s lower boundary, where a breakdown leads to a further drop that targets 0.1653 (27 May low). The 7 June low at 0.1706 forms an intervening pitstop to this decline, but the measured move will come in at 0.1474 if the bears overcome these support obstacles.
CRO/USDT: 4-hour Chart