

- The Loopring Price is grappling with a significant support level, which desperately needs to hold to keep the bull market intact.
The Loopring Price is grappling with a significant support level, which desperately needs to hold to keep the bull market intact.
In November, Loopring (LRC) was one of the best performing cryptocurrencies, closing out the month with a +388% gain after being up over 500% at one stage. This morning, the LRC token is unchanged at $2.783 (+0.39%), although down around 30% over the last week. In that time, almost $1.2 billion was wiped from the project’s market capitalization. Despite this, Loopring is the 51st most-valuable cryptocurrency behind Flow.
After setting a record of $3.977 on November 10th, the price-action became highly unpredictable. Within a week, LRC was trading at $2.130 and a week after almost back at the highs. Since then, the price has reverted to a downtrend, which has forced a test of upturned support.
LRC Price Forecast
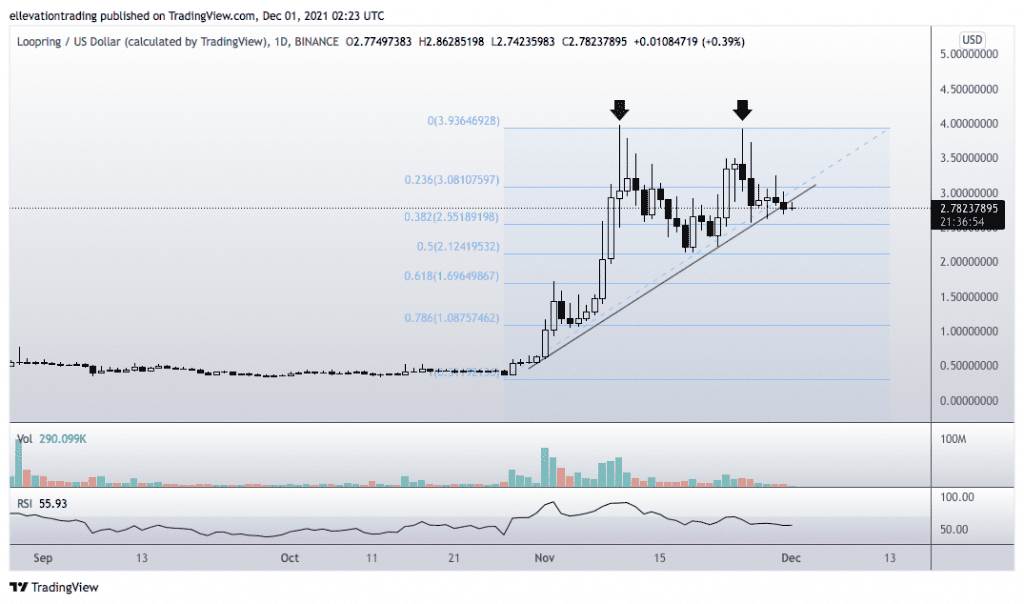
The daily chart shows the Loopring price is trading just below the trend support (now resistance) at $2.877. And in my opinion, a close below the trend for the second day running will confirm a bearish breakdown. In that event, sellers may test the resolve of the longs and push the price down towards the November 18th low (and 50% Fibo retracement) at $2.130.
Whilst the price should find good support at $2.130, there is also a chance the support fails. In that event, a steeper sell-off could target the 61.8% Fibonacci retracement, aligned with the former all-time high at $1.723.

However, if LRC closes above the trend, the builds will claim victory. And if that happens, LRC may continue north, targeting the ATH.
Loopring Price Chart (Daily)
For more market insights, follow Elliott on Twitter.