

- The Contentos price predictions will rely on the chart patterns and the emerging engulfing candle for direction.
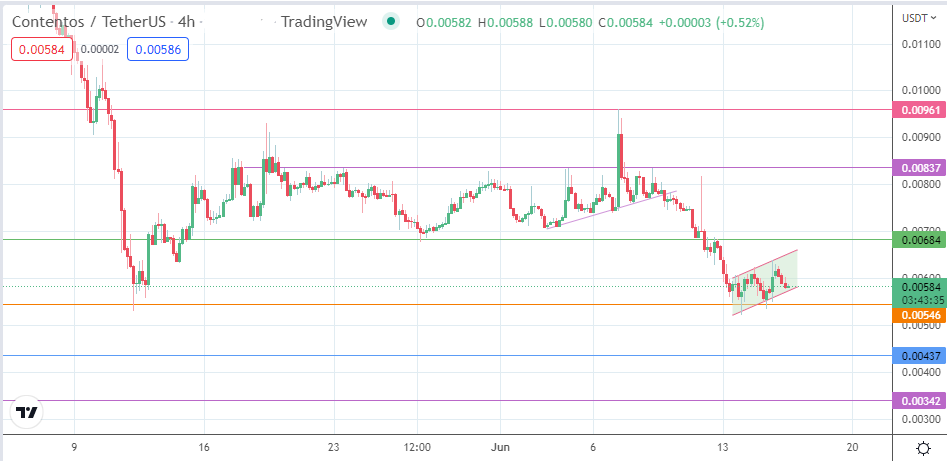
The COS/USDT pair is down 5.52% this Thursday, erasing all the gains acquired in the last two days to restore bearish Contentos price predictions in the market. With the price action close to forming a bearish engulfing candlestick, the price action is in danger of taking a move to the south. This scenario will validate the emerging bearish flag pattern on the 4-hour daily Chart.
The Fed’s 75bps move sent cryptos into a pseudo-recovery mode, enabling them to wipe off Wednesday’s losses. But as the dust settles, the market sentiment appears to have picked up from where it left off. This sentiment will dominate the price action on the COS/USDT pair in the short term.
Fundamentally speaking, Contentos ecosystem is set to launch its new NFT feature at the end of June. So far, the network has launched its first round of Metaverse and upgraded its COS.TV personal centre. The new NFT feature will allow NFT creators to join its decentralized creator ecosystem and create a possibility for collaboration with thousands of NFT projects. However, attaining these milestones will not impact the price action in the short term.
Technically speaking, the emerging chart pattern and candlestick pattern could provide clues as to the direction of the Contentos price predictions ahead of the weekend.

Contentos Price Prediction
The 4-hour Chart shows an emerging bearish flag pattern, with the price action set to challenge the lower border of the consolidation area. A breakdown of this area completes the pattern and opens the door to a measured move that targets the 0.00437 support level (). If there is further price deterioration, the 0.00342 support mark becomes the additional target to the south. This scenario would require the bears to break down the immediate barrier to the breakdown move at 0.00546 (12 May and 13 June low).
On the flip side, a bounce on the flag’s lower border which eventually attains the 0.00684 resistance, will take out the upper edge of the consolidation area. This move will invalidate the pattern in the process. However, an additional advance requires the bulls to uncap the 0.00684 barrier (15 May low and 12 June high), targeting the 23 May and 9 June highs at 0.00837. The 10 May/7 June highs at 0.00961 form an additional target to the north that is only viable on a strong market recovery.
COS/USDT: 4-hourly Chart