
- Gold hits record highs above $4,700 amid geopolitical and trade tensions.
- Market focus shifts to $5,000 target as traders assess pullback risks.
- Gold is now up +78% over the last 12 months in one of its best runs in history.
Gold prices surged to fresh all-time highs during the Asian trading session on Tuesday, January 20, 2026, with XAU/USD breaking decisively above the $4,700 level as safe-haven demand intensified overnight. The rally accelerated in early Asia after renewed geopolitical tensions linked to U.S. tariff threats toward Europe over Greenland pushed investors out of risk assets and into bullion.
According to Barron’s, the move was reinforced by a weaker U.S. dollar and growing concern over trade and policy uncertainty, driving strong follow-through buying as markets transitioned toward the European open.
Gold is now up +78% over the last 12 months in one of its best runs in history.
Why Is Gold Soaring Today?
Gold’s latest surge comes as markets react to rising geopolitical stress linked to U.S.–Europe tensions over Greenland, following President Donald Trump’s threat to impose escalating tariffs on several European countries unless a deal is reached. The rhetoric has reignited fears of a broader trade conflict, pushing investors away from risk assets and into traditional stores of value.
According to coverage from CNBC and Bloomberg, gold demand has accelerated as investors reassess geopolitical risk, policy credibility, and the stability of global trade relationships. Equity markets across Europe have sold off, while capital has rotated aggressively into precious metals.
At the same time, pressure on the US dollar has amplified gold’s upside. The US Dollar Index has slipped below the 99 level, making dollar-denominated gold more attractive to global buyers and reinforcing the breakout.
Gold Breaks Records as Safe-Haven Demand Accelerates
From a price perspective, gold’s rally has been decisive. Spot gold and futures have both cleared the $4,700 psychological barrier, a level that had capped gains during earlier consolidation phases. Momentum accelerated as stop-losses were triggered and trend-following flows entered the market.
Analysts quoted by CNBC note that this rally is underpinned by fundamentals, not just headline risk. Expectations that real yields could fall further in 2026, combined with continued central bank diversification into gold reserves, have created a supportive backdrop for higher prices rather than a sharp correction.
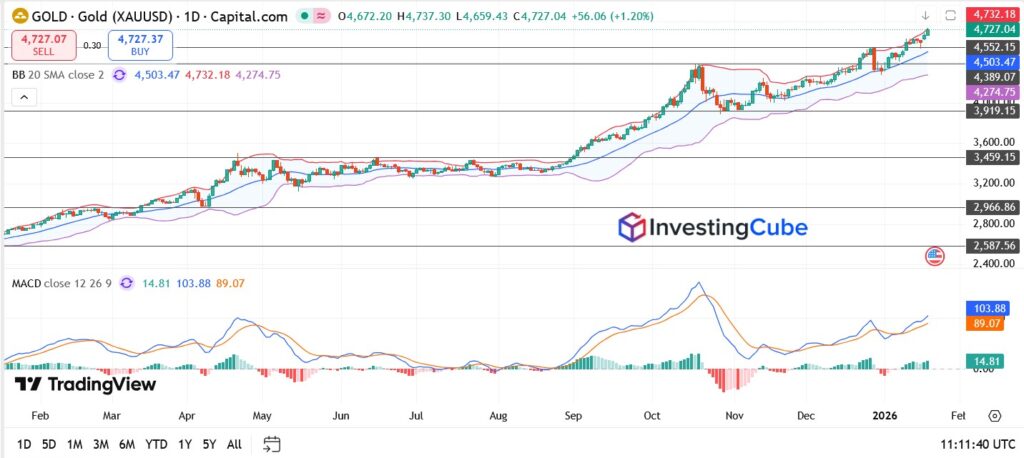
Gold (XAU/USD) Daily Chart Analysis
Trend: Gold remains in a strong, well-defined bullish trend, with price continuing to print higher highs and higher lows into January 2026.
Breakout: Price has broken above the prior resistance zone near $4,700, confirming a fresh upside continuation rather than a false spike.
Key Support Levels:
- Immediate support sits near $4,550–$4,580, aligned with the 20-day moving average.
- A deeper pullback would likely find buyers around $4,500.
Key Resistance Levels:
- Psychological resistance is now in focus near $4,750.
- A sustained break above this zone opens the door toward $4,900–$5,000 in extension scenarios.
Can Gold Prices Go Beyond $4,700?
Yes, and the market is already testing that scenario.
With $4,700 now acting as a pivot rather than resistance, the next upside targets come into focus at $4,750 and $4,800. A sustained close above current levels would increase the probability of a continuation move rather than a short-term blow-off.
However, round numbers matter. As prices extend further above $4,700, traders should expect periods of consolidation or shallow pullbacks, especially if geopolitical headlines cool or profit-taking emerges. That said, there is currently little evidence of distribution in the price action.
The “Greenland” Trade Conflict: President Trump’s threat of a 10% tariff on European nations (rising to 25% by June) has sparked fears of a full-scale transatlantic trade war.
Fed Independence Concerns: Legal challenges regarding the President’s power to remove Federal Reserve governors have created a “trust premium,” making gold more attractive than the U.S. dollar.
Global Instability: Tensions in Venezuela and Iran continue to simmer, further cementing gold’s role as the ultimate hedge against chaos.
Gold is now trading comfortably above $4,700, the $5,000 level has become the most searched forecast target globally. I believe the move is achievable in the first half of 2026 if geopolitical tensions persist, the US dollar remains under pressure, and central banks continue accumulating gold.
A sustained break above current highs would likely accelerate momentum toward the $5,000 psychological milestone.
This is one of the most searched questions as Fear Of Missing Out builds after gold’s rapid surge. While prices are elevated, many investors are now shifting focus to buying on pullbacks rather than chasing breakouts.
At the same time, interest in silver has surged as it trades above $95 per ounce, with some viewing it as a lower-priced way to gain exposure to the precious metals rally.
Searches for “gold price pullback” and “technical resistance” have jumped as traders assess whether gold is overextended near record highs. After such a sharp rally, short-term corrections are possible, especially if profit-taking emerges near key resistance levels.
However, as long as gold holds above major breakout zones, any pullback is widely seen as consolidation rather than a trend reversal.