

- The gold price prediction will get clearer after the definition of price behaviour at the triangle's upper boundary.
What is the current gold price prediction after US data faltered on Tuesday November 25, 2025?
Gold prices resumed their upward move after recent US data fueled the increased expectations of a lowering of US interest rates by the US Federal Reserve in its December 2025 meeting. Lower interest rates make non-yielding assets such as gold and silver more appealing to investors.
US data have been sparse and heavily delayed as a result of the longest US government shutdown in history that impeded the ability of several government agencies to gather and publish macroeconomic data. The latest consignment of US data showed a modest increase in retail sales (headline and core) by 0.2% and 0.3%, respectively. These numbers represented a month-on-month drop, having registered at 0.6% each previously. Core PPI rose modestly by 0.1%, less than the 0.2% forecast. Consequently, CME Fed Funds futures are pricing in an 85% rate cut in the December meeting, as per the Fedwatch tool.

MUFG’s FX Daily Snapshot on 26 November 2025 opines that continued dollar selling will follow reports of Kevin Hassett (whom markets describe as a “lower rates guy”) emerging as a frontrunner to replace Jerome Powell as Fed Chair. Gold is up 0.17% on the day as of writing.
Gold Technical Analysis
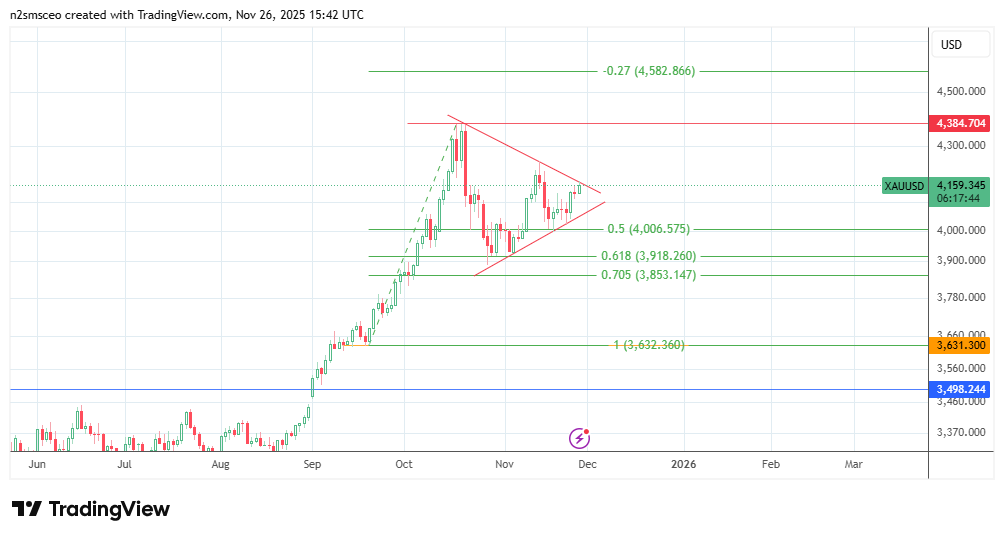
The upper boundary of the triangle is now being tested by the active daily candle. A breakout at this border makes a case for a retest of the current all-time high at 4381. Continuation of the uptrend follows a break above the current record high, with the 27% Fibonacci extension tool at 4582 (19 September to 20 October upswing) serving as a potential new upside target.
Only if there is a rejection and retreat from the current barrier does the 18 November low at 4006 (50% Fibonacci retracement level) become a feasible downside target. Other Fibonacci retracement levels at the 61.8% level (3918) and the 70.5% level (3853) become visible if 4006 is degraded.