- Gold has outstripped all 2025 gold price predictions. Does the data support its status as an inflation hedge?
Introduction
Gold as an asset has exceeded most, if not all, gold price prediction forecasts for 2025. Gold is no longer the asset that sits quietly, waiting for the passage of time for investors to realize what it has been doing in the shadows. Gold rates today are firmly above $ 4,000, beating gold price forecasts for 2025 from several banks. Annual gold price returns so far in 2025 have hit 53.9%, its highest recorded annual return in recent history. This figure is more than double the annual returns of 2024, which hit 27.2%, and the 2020 pandemic-year return of 24.4%.
A financial hedge is an investment to protect a currency’s purchasing power against the negative impact of rising cost of goods and services. Gold price rates over time have met this classical definition, and this article will prove this with data.
Section 1: Core Concept and Current Market Context
In financial terms, a hedge’s definition centers on inflation. Inflation is a situation where goods and services cost more over time, requiring more currency to pay for them and reducing the currency’s purchasing power. What creates inflation, and why does this bring about a need to safeguard against it?
An expanding global population that is living longer produces a situation where there is greater demand and competition for goods and services intended to meet human needs and wants. With global inefficiencies in the production and distribution of these need-meeting products and services, there will always be a supply deficit amid growing demand, leading to higher prices.
Various publications by global financial institutions have extensively discussed the conditions that reduce a currency’s purchasing power. These conditions are more prevalent in our world today than in centuries past. The International Monetary Fund’s October 2025 World Economic Outlook Report emphasizes that global inflation would remain “persistently higher” than pre-shock baselines.
The fact that the world continues to face persistently high inflation despite several central bank interventions post-COVID underscores the need for deploying inflation-beating tools and investment assets, which is why gold continues to serve as the go-to inflation hedge.
Section 2: Data Analysis and Evidence
Gold purchases by governments and individuals are also on the rise. The Polish government, through the National Bank of Poland, has been reported as the biggest buyer of gold this year, buying about 68 tonnes in H1 2025 alone. Data from Forbes confirms that Poland is the top buyer of gold year to date (YTD). The National Bank of Kazakhstan is reported to be the largest gold buyer in Q3 2025, with an 18-tonne acquisition, bringing its holdings to 40 tonnes. The Azerbaijan Sovereign Wealth Fund (State Oil Fund of Azerbaijan or SOFAZ) comes in third with a 39-tonne gold purchase spread over Q1-Q3 2025. The Central Bank of the Republic of Turkey and the People’s Bank of China (PBoC) rank 4th and 5th, respectively, according to official figures, even though unofficial reports suggest China may be the largest gold buyer.
China and India currently top the list of countries with the highest individual gold purchases, according to the World Gold Council’s consumer demand data. In China, demand has reportedly shifted from jewelry (decorative or ornamental) to coins and bars (hedge or safe-haven buying). Purchases of bars and coins in China rose 24% year-on-year in H1 2025. Iran, Turkey, Saudi Arabia, and Vietnam continue to show strong demand for gold bars and coins. These datasets for institutional and individual buyers show that gold remains a sought-after hedge in 2025.
Section 3: Comparative Scenarios
We compare two scenarios for gold prices: conditions under which gold would keep rising, and conditions that would cause a reversal below the $ 4,000 psychological price level.
Scenario A: Trend continuation -> price fundamentals that support an increase in gold prices include declining interest rates, global market upheavals, another pandemic, and an increase in central bank purchases.
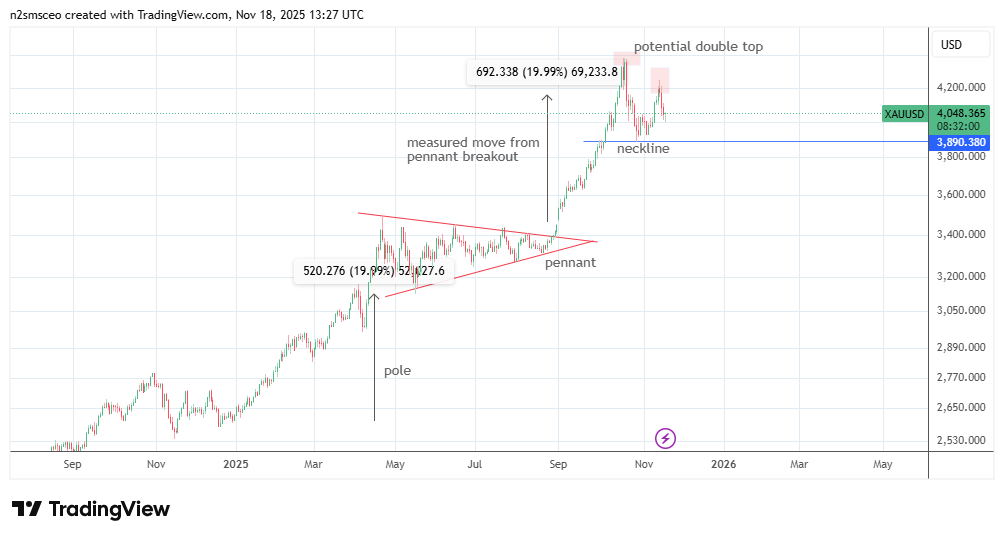
Technical picture: gold prices have hit the bullish pennant’s measured move price projections. The latest move looks overextended, and only new highs above the current all-time high at $4381 will sustain the uptrend.
Scenario B: Trend reversal -> conditions that would cause a reversal include declining institutional interest, profit-taking by institutional buyers, a bounce-back in the crypto market, and a pause in US rate cuts.
Technical picture: decline below the neckline support at $3890 on completion of the emerging double top. This setup favours a decline in the medium term to $3400-$3500.
Section 4: Broader Implications
How has the recent price spikes in gold impacted global markets and investors?
Gold is a non-yielding asset. It attracts demand when other markets are floundering. The crypto selloff in November 2025 wiped out billions in investor funds, but gold remains firmly above $ 4,000. Some of the money that could have propped up the crypto market is now flowing into gold.
Section 5: Expert Insight
Gold remains in a long-term uptrend. However, the presence of progressively declining tops makes a strong case for a short-term correction. This is especially important as the initial top and all-time high at 4381 completes the bullish pennant’s breakout projection.
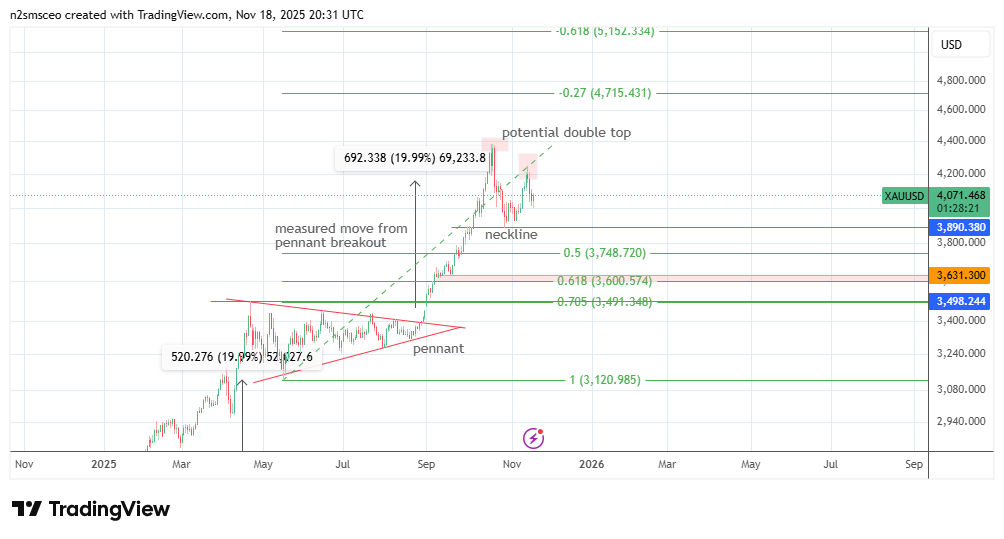
The strong impulsive Fibonacci upswing leg, commencing from the 3120 swing low (Fibonacci retracement 1.0), paints retracement levels at 3748 (50%), 3600 (61.8%, just below the 3631 Sept 2025 low), and 3491-3498 (70.5%). The neckline support at 3890 is the critical price barrier.
Bull case: Uptrend continuation is favoured by a price bounce on the neckline or, at the very least, a higher low above the 50% Fibonacci mark at 3748. If this bounce translates into a higher top above the double top zone (i.e, a higher high above 4381), then the Fibonacci extensions at 4715 (27% Fibo extension) and a stretched target at 5150 (61.89% extension) become potential upside targets.
Bear case: A closing penetration signals a correctional move to the south, where the aforementioned Fibonacci price points line up as potential targets. This is especially true if the decline slices below the 50% Fibo retracement at 3748, opening up deeper targets and invalidating the uptrend.
Section 6: References and Sources
- International Monetary Fund. (2025). World economic outlook: Global economy in flux, prospects remain dim (October 2025). IMF. https://www.imf.org/en/publications/weo/issues/2025/10/14/world-economic-outlook-october-2025
- World Gold Council. (2025). Gold demand trends Q3 2025. Goldhub. https://www.gold.org/goldhub/research/gold-demand-trends/gold-demand-trends-q3-2025
- Reuters. (2025, June 17). Central banks favour gold over dollar for reserves, WGC survey. Reuters.
- Fleming, S. (2025, May). Gold overtakes euro as global reserve asset, ECB says. Financial Times.
- Salisu, A. A., Ndako, U. B., & Oloko, T. F. (2019). Assessing the inflation hedging of gold and palladium in OECD countries. Resources Policy, 62, 357–377. https://doi.org/10.1016/j.resourpol.2019.05.001