
- Crude oil prices are facing pressure from multiple fronts ranging from calming of Russia-Ukraine war tone to OPEC+ delicate balancing act and long-term pressure from EVs.
- Goldman Sachs recently forecast a sub-$57 oil price by next year, pointing to supply glut.
- Geopolitical risks in the Middle East continues to provide some support to the upside.
Over the past two days, oil prices have seen a big rise, breaking a long-term declining trend. You might wonder if this flicker of green signals a broader turnaround, or if it’s just a brief respite in a downtrend plagued by oversupply and tepid demand. Recent data shows that the fundamentals are unstable, but short-term sparks imply that the rally could last, at least for a little while. The question now for energy traders and policymakers is whether this current momentum can be sustained or if it is merely a short-lived counter-trend reaction.
What’s Driving the Oil Price Uptick?
The bounce comes against a backdrop of persistent headwinds. U.S. crude inventories surged unexpectedly last week, as per the Energy Information Administration’s data cited by Reuters, reinforcing fears of a global glut. OPEC+ has held steady on output, with no fresh cuts on the horizon, while China’s economic slowdown caps demand growth.
Still, prices have gained ground in the last 48 hours because of two things: renewed expectations that the Federal Reserve will cut interest rates to boost the economy, and doubts that a quick peace deal will be reached between Russia and Ukraine, which has eased supply concerns. These things have pushed out some negative bets, allowing WTI to stabilize around the 50-day moving average.
Is the Momentum Sustainable?
The uptrend probably won’t last for long. Even though the technical setup provides some room to breathe, this rebound feels more like a temporary recovery than a real change in trend. According to Trading Economics, prices have fallen by 13.91% in a month, which shows that demand is weak. If inventories keep climbing, as projected by Goldman Sachs, sub-$57 becomes probable by year-end.
Several thorns loom for bulls. First, escalating U.S.-Russia diplomacy could unlock more Russian exports, flooding the market. Second, if inflation stays high, the Fed might delay cutting rates, which would reduce demand. Third, OPEC’s monthly report pointed out that non-OPEC supply growth from places like Brazil and Guyana is adding more oil while consumption remains stagnant. Geopolitical tensions, like those in the Middle East, could offer some support, but the current situation favors lower prices.
WTI Crude Oil Price Chart
WTI has strong support at $58.00 and even stronger support at $57.15, which will help it stay steady in the immediate term. The first level of resistance is anticipated to be $59.55, just above the Volume Weighted Moving Average (VWMA). If the price breaks through this level, it could go up to $60. The stochastic indicator at 50.96 shows that momentum is towards the upside.
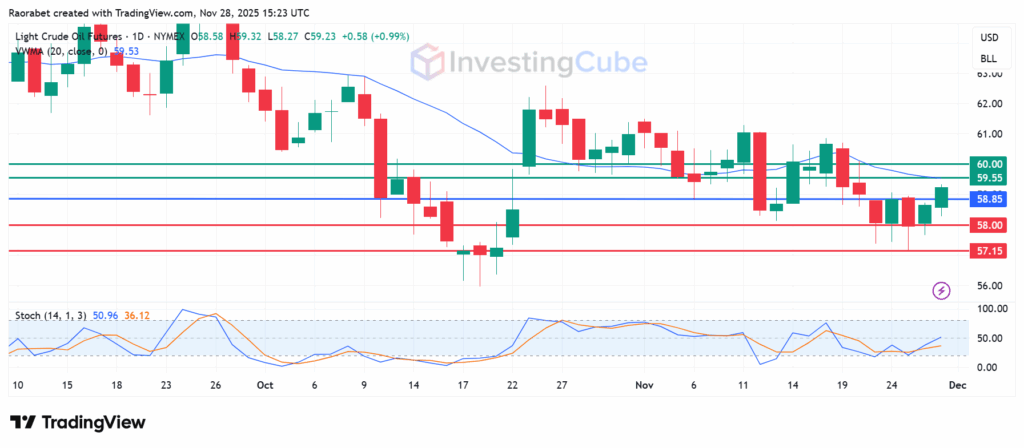
WTI oil price daily chart on November 28,2025 with key support and resistance levels. Created on: TradingView
The rebound is fueled by fear of supply disruption from sanctions against Russian oil firms and an urgent, short-term demand for crude oil caused by depleted product stocks as global refinery runs are expected to increase.
Demand growth remains modest as consumption stagnates in advanced economies. The accelerated adoption of EVs further moderates overall global oil consumption, reducing the market’s capacity to absorb rising supply.
Short-term yes, but unlikely longer-term. Oversupply, rising U.S. inventories, and tepid demand cap upside; the rebound looks like oversold relief rather than a trend reversal.