

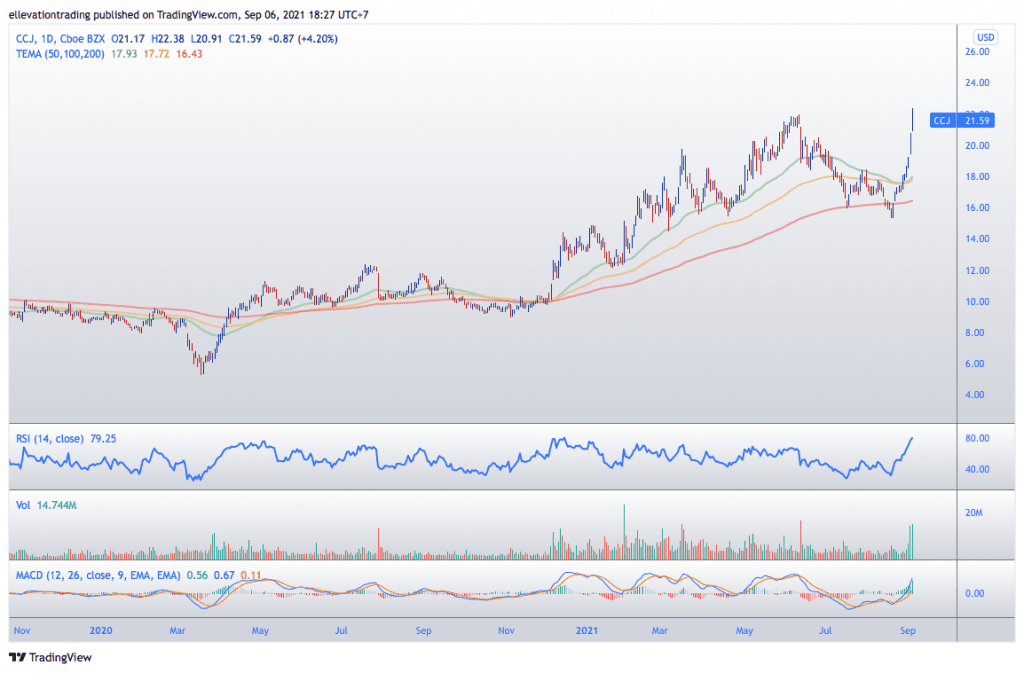
- Cameco stock (NYSE: CCJ) jumped to its best week since March 2020, surging more than 21% to a new seven-year high of $22.38.
Cameco stock (NYSE: CCJ) jumped to its best week since March 2020, surging more than 21% to a new seven-year high of $22.38. This comes on the back of analysts scrambling to raise their price targets as the cost of spot Uranium reaches a six-year high.
Saskatchewan-based Cameco Corp, is the world’s largest publicly traded uranium company, capable of producing 53 million pounds annually. And its this that makes Cameco stock heavily reliant on the price of Uranium. Well, thankfully, for shareholders, uranium is on a tear.
Investors have been piling into Exchange Traded Funds (ETF’s) that track the price of Uranium. The buying pushed the price to its highest level since 2015. Furthermore, the ‘uranium supercycle’ chatter is starting to grow, prompting even more ETF buying.
As a result, Cameco stock has been subject to two analyst upgrades recently, with price targets ranging as high as $27.00, around 25% above Friday’s close.
CCJ Technical Analysis
Looking at the daily chart, it’s clear the Cameco stock price is extremely overextended. The Relative Strength Index (RSI) on the daily time frame is at a decade high of 79.25. Furthermore, because it relies on the uranium price, the stock is extremely volatile. Commodities can experience wild price swings, which play a factor in the share price of their producers and consumers.
This makes an accurate Cameco price prediction extremely tricky. The signs are the company is well-positioned to take advantage of rising uranium prices. However, after such an impressive run, timing is everything.
So far this year, Cameco is up 60%. Not to mention that CCJ has gained 300% since the March 2020 low. Therefore, despite offering an interesting long term opportunity, buying here is dangerous. That being said, even after this, Cameco is 67% below its all-time high of $56.00.

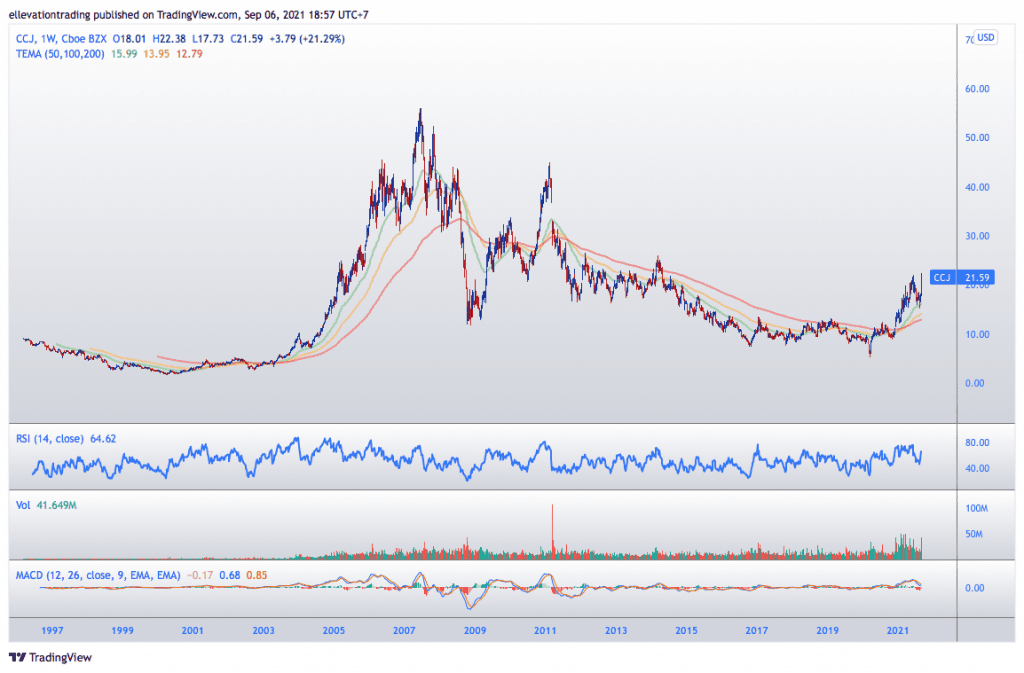
Additionally, the weekly chart does look encouraging. On Friday, the price closed above this year’s former high, which indicates a breakout. If buying continues this week, it would further validate this and put the March 2014 high of $25.84 into focus. Furthermore, if the price clears $25.84, the next area to watch is around $33.00.
However, if the stock closes lower this week, that would leave an ominous double-top pattern. This would likely result in a correction to the 50, and 100-day moving averages between $17.72 and $17.92.
Cameco Stock Price Chart (Daily)
CCJ Weekly Chart
For more market insights, follow Elliott on Twitter.