Archived Article This article was published more than 5 months ago. The market data, prices, forecasts, and analysis were accurate at the time of publication but may have changed since then. Please use this article for historical reference only and refer to our latest content for current market information.
Bitcoin prices have slipped 7.95% on the day after the BTCUSD’s bulls failed to attain last week’s all-time high. Cryptopotato.com reports that as much as $340 million was wiped off long positions by today’s drop, which saw as much as $3000 wiped off Bitcoin prices.
Technical Levels to Watch
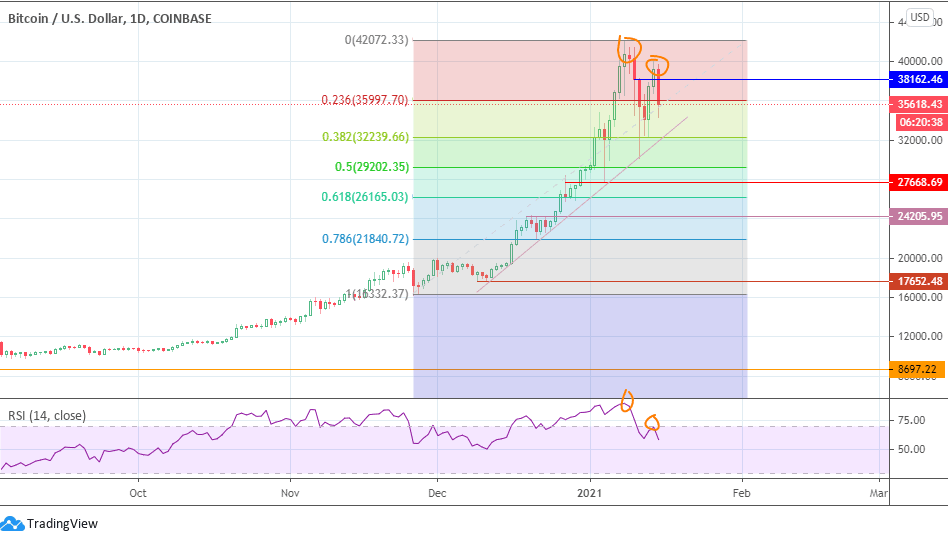
The failure of bulls to attain last week’s high presents a double top with progressively lower highs, which indicates that the upside may have stalled. The drop on the day has found support at 35997 after an intraday violation of that area was rebuffed by buyers.
If that price level gives way, then 32239.66 (38.2% Fibonacci retracement level) could be the next downside target. This price level also coincides with the support provided by the ascending trendline that connects the lows of 12 December/24 December 2020, and 4 January/11 January 2021.

A breakdown of this price level targets 27668.69 initially (4 January low), with 26165.03 also stepping into the picture if the decline continues.
On the flip side, a bounce on the present support or the ascending trendlibe may allow for some recovery, but any price push towards new highs
has to come at the instance of increased bullish momentum that breaks the double top setup.
BTCUSD Daily Chart