

- BT share price seems to have met a resistance after the company reported a 20% drop in its after-tax profits as well as revenues.
BT share price finds itself under pressure after the BT Group reported earnings that showed a 20% slump in after-tax profits for H1 2020. This was the coronavirus pandemic forced a shuttering of sporting events that led to a decline in the business activity of this communications company and subsequent loss of revenue from BT Sport.
Earnings per share came in at 0.086 pounds per share, which represents a shortfall from the 0.11 pounds per share it reported in the same period in 2019. Revenues fell from 11.47 billion pounds in the same period in 2019 to 10.59 billion pounds, forcing the company to shelve interim dividend payments. BT has raised the floor for its 2021 projected earnings before interest, taxes, depreciation and amortization from 7.3 billion pounds to 7.3 billion pounds. The stock is trading 2.6% higher today after yesterday’s steep drop.
Technical Outlook for BT
BT share price is now trading in a range to form a rectangle pattern, with 112.70 acting as the ceiling and 98.02 acting as the floor. The active daily candle is challenging a resistance at 98.02, which is where the lows of 7 May, 6/21 August, 22 September and 8 October are found. The RSI momentum indicator is showing progressively lower highs; the so-called failure swing which portends gradual weakening of buying pressure on the stock.
Suppose BT share price obeys the oscillator’s signal and is rejected at the 101.22 resistance. In that case, this could cascade into a breakdown of the rectangle pattern, allowing BT share price to target the 91.62 and possibly the 84.96 price levels. These are support targets that correspond to lows last seen in May 2009.

On the flip side, if BT share price can acquire buying pressure to push above `101.22, then 106.82 becomes the next viable target. This level and the ceiling of the range need to give way to additional buying pressure for the breakout to occur. This breakout move would then contend with the 200-day moving average as dynamic resistance, located at the 120.44 price level. 128.70 and 136.18 are additional viable targets to the north.
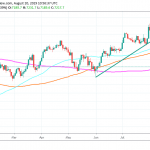
BT Share Price Chart
