

- Brent Crude Oil Price Prediction: Brent Oil is having a major pullback due to weak Chinese economic data and the rising DXY Index.
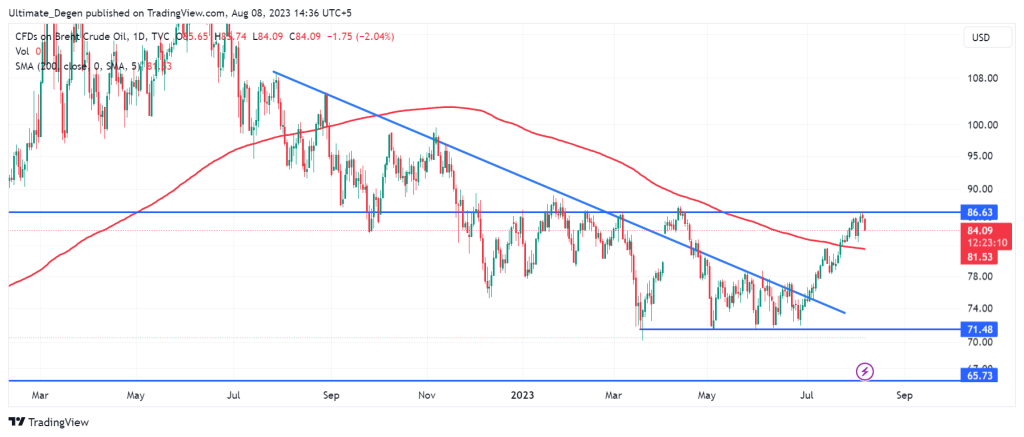
Brent crude oil price is having a pullback after a major rally in the past few weeks. After retesting its yearly lows at the end of June 2023, Brent oil price surged more than 20%. However, the price failed to break above its $86.75 resistance level, which was forecasted in my previous analysis.
On Tuesday, the correction in oil prices deepened, and Brent crude price plummeted by 1.81%. Today’s negative price action comes after a 0.17% drop on Monday and can be attributed to the weak Chinese economic data. The technical analysis reveals that this could be a beginning of a major correction.
Brent Oil Price Drops On Weak Chinese Economic Data
The Chinese economy is struggling to recover to its pre-pandemic levels. Even months after the lockdown restrictions have ended, the country’s exports remain unimpressive. The latest economic data has shown that Chinese imports and exports dropped more-than-expected in July. This triggered a pullback in the Brent crude oil price.
Another reason behind the weakness in oil prices is the strengthening US dollar. The DXY index has soared above 102 points after dropping below 99 points in July. This strength comes due to the last month’s 25 bps rate hike by the US Federal Reserve.
Brent Crude Oil Price Prediction – August 2023
A look at the following Brent crude chart reveals that the price has been trading within the $71.5-$86.75 region since November 2022. There seems to be a massive supply zone at the top of this range which has resulted in multiple rejections. This week’s pullback also occurred from exactly the same level.

Brent crude oil price prediction will flip very bullish if it breaks above the $86.75 level. However, if the DXY Index extends its gains, a retest of the 200 MA may also occur in the coming days. The key moving average currently lies at $81.5. A retest of this level may generate a strong bounce.
In the meantime, you are also welcome to follow me on Twitter to keep track of my personal trades and the updated outlook on Brent.