Bitcoin price (BTCUSD) is down by 0.63% today as traders continue to focus on the strength of the US dollar. The cryptocurrency is trading at $11,311, which is slightly below the August high of $12,430. Other currencies like Ethereum, Ripple, and Chainlink are down by more than 10.45%, 10%, and 11.4%, respectively. This decline has pushed the total market cap of cryptocurrencies down to more than $372 billion.
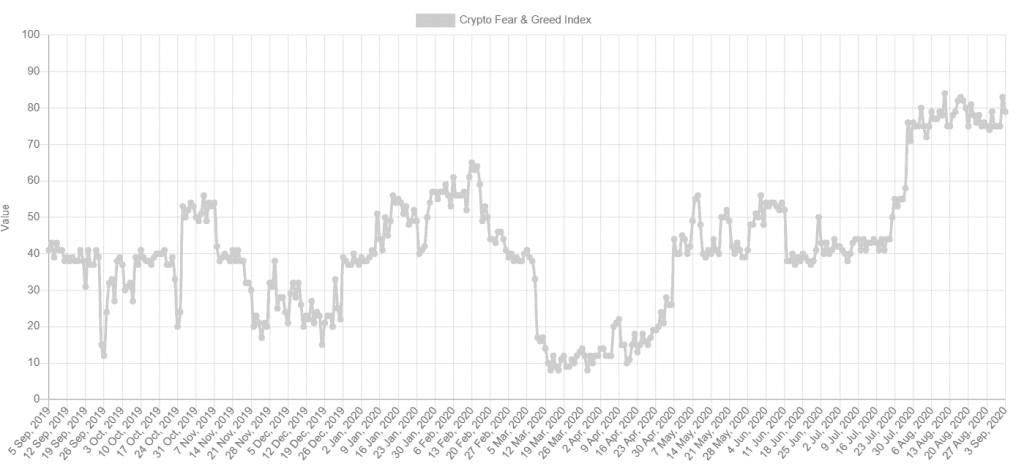
Bitcoin price is falling even as the crypto fear and greed index in the cryptocurrency industry signal that investors are getting extremely greedy. The index is now at 79, which is slightly lower than yesterday’s high of 83.
For starters, the crypto fear and greed index is modelled in a way similar to the S&P 500 fear and greed index that was created by CNN Money. The index is created by looking at the Bitcoin’s volatility in the past 30 and 90 days. It also looks at the market momentum, social media sentiment, dominance, and trends. On trends, the data compiles data from Google Trends and other digital sources.
To most traders, extreme greed level is usually a bearish factor while an extreme fear is usually a bullish factor. For example, as you can see below, Bitcoin price dropped to the YTD low when the crypto fear and greed index was in its multi-year low. As BTC price recovered, so did the index.
Crypto fear and greed index
Meanwhile, Bitcoin price is falling in the same week that the dollar has gotten stronger. The US dollar index is up by 0.25% today as investors start to bet on a V-shaped recovery in the United States. This is evidenced by recent strong employment, manufacturing, and factory order data.
So, has Bitcoin price peaked?
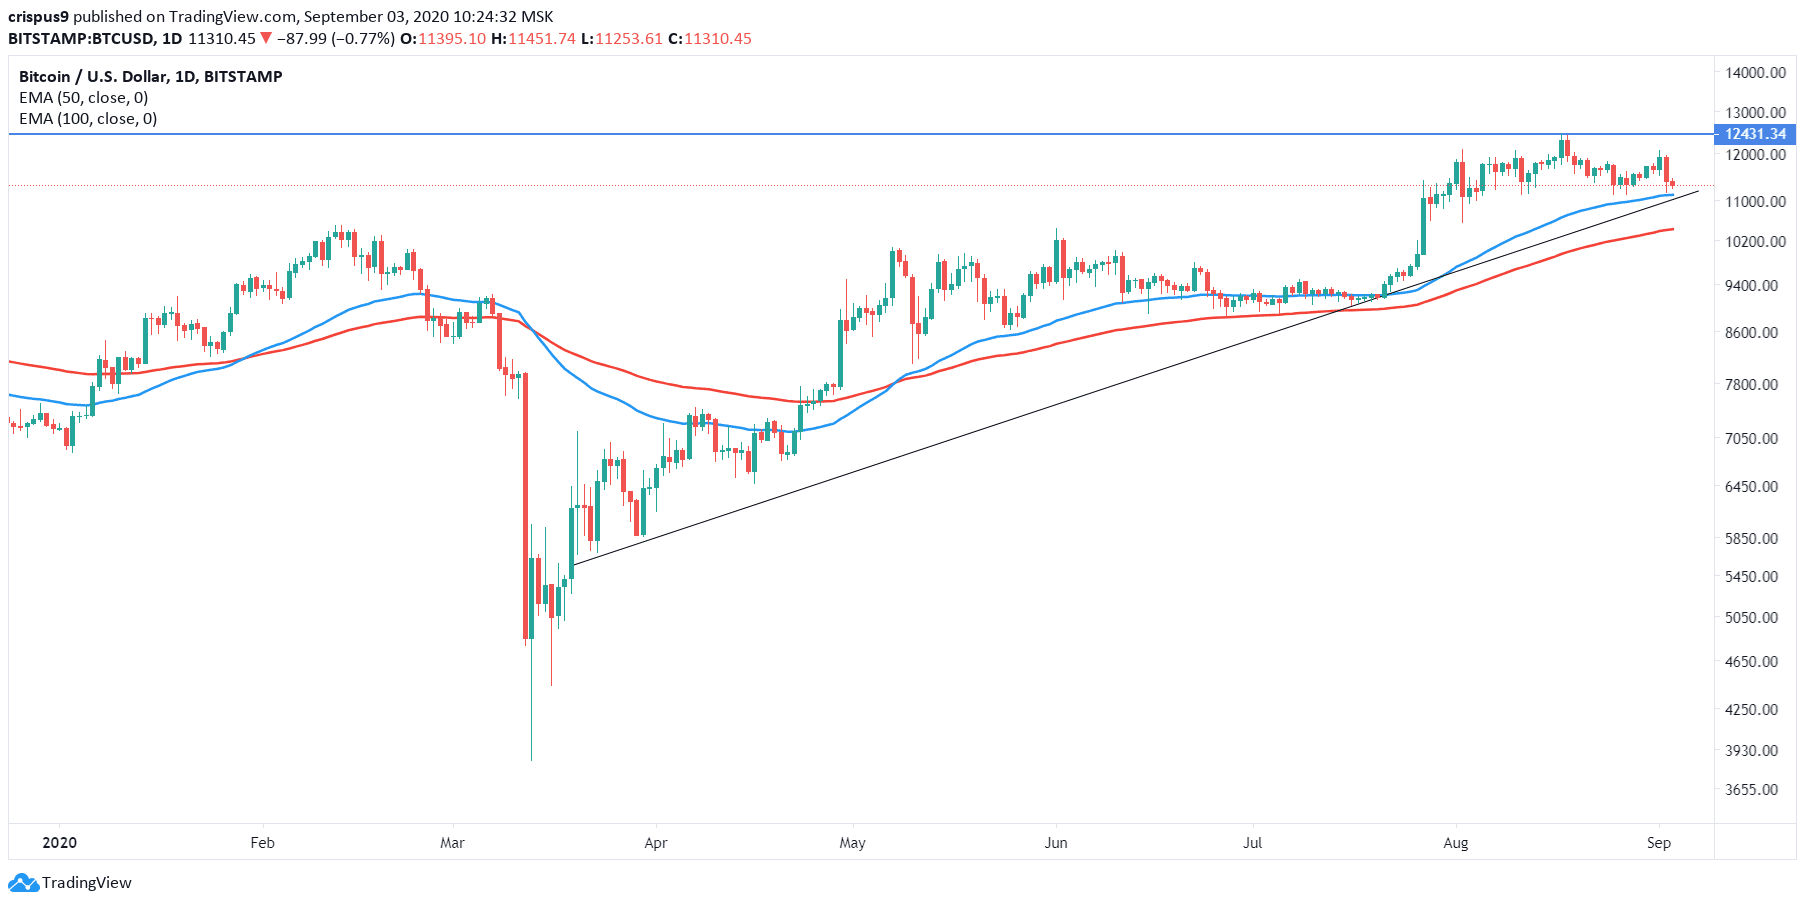
The daily chart shows that Bitcoin price reached a YTD high of $12,430 in August. Since then, the price has faced significant resistance. It also seems to be forming a head and shoulder pattern, which is usually a bearish sign as you can see in our free trading course. The price remains above the 50-day and 100-day exponential moving averages.
It is also slightly above the ascending trend line that is shown in black. Therefore, while the trend remains bullish, there is a possibility that the BTCUSD pair will have a slight pullback in the near term. Obviously, a move above the YTD high will invalidate the pullback argument.
Don’t miss a beat! Follow us on Telegram and Twitter.
Bitcoin Price Technical Chart
More content
- Download our latest quarterly market outlook for our longer-term trade ideas.
- Follow Crispus on Twitter.
- Do you enjoy reading our updates? Become a member today and access all restricted content. It is free to join.